Photo AI
Prove by mathematical induction that, for n ≥ 1, 2 − 6 + 18 − 54 + .. - HSC - SSCE Mathematics Extension 1 - Question 13 - 2018 - Paper 1
Question 13
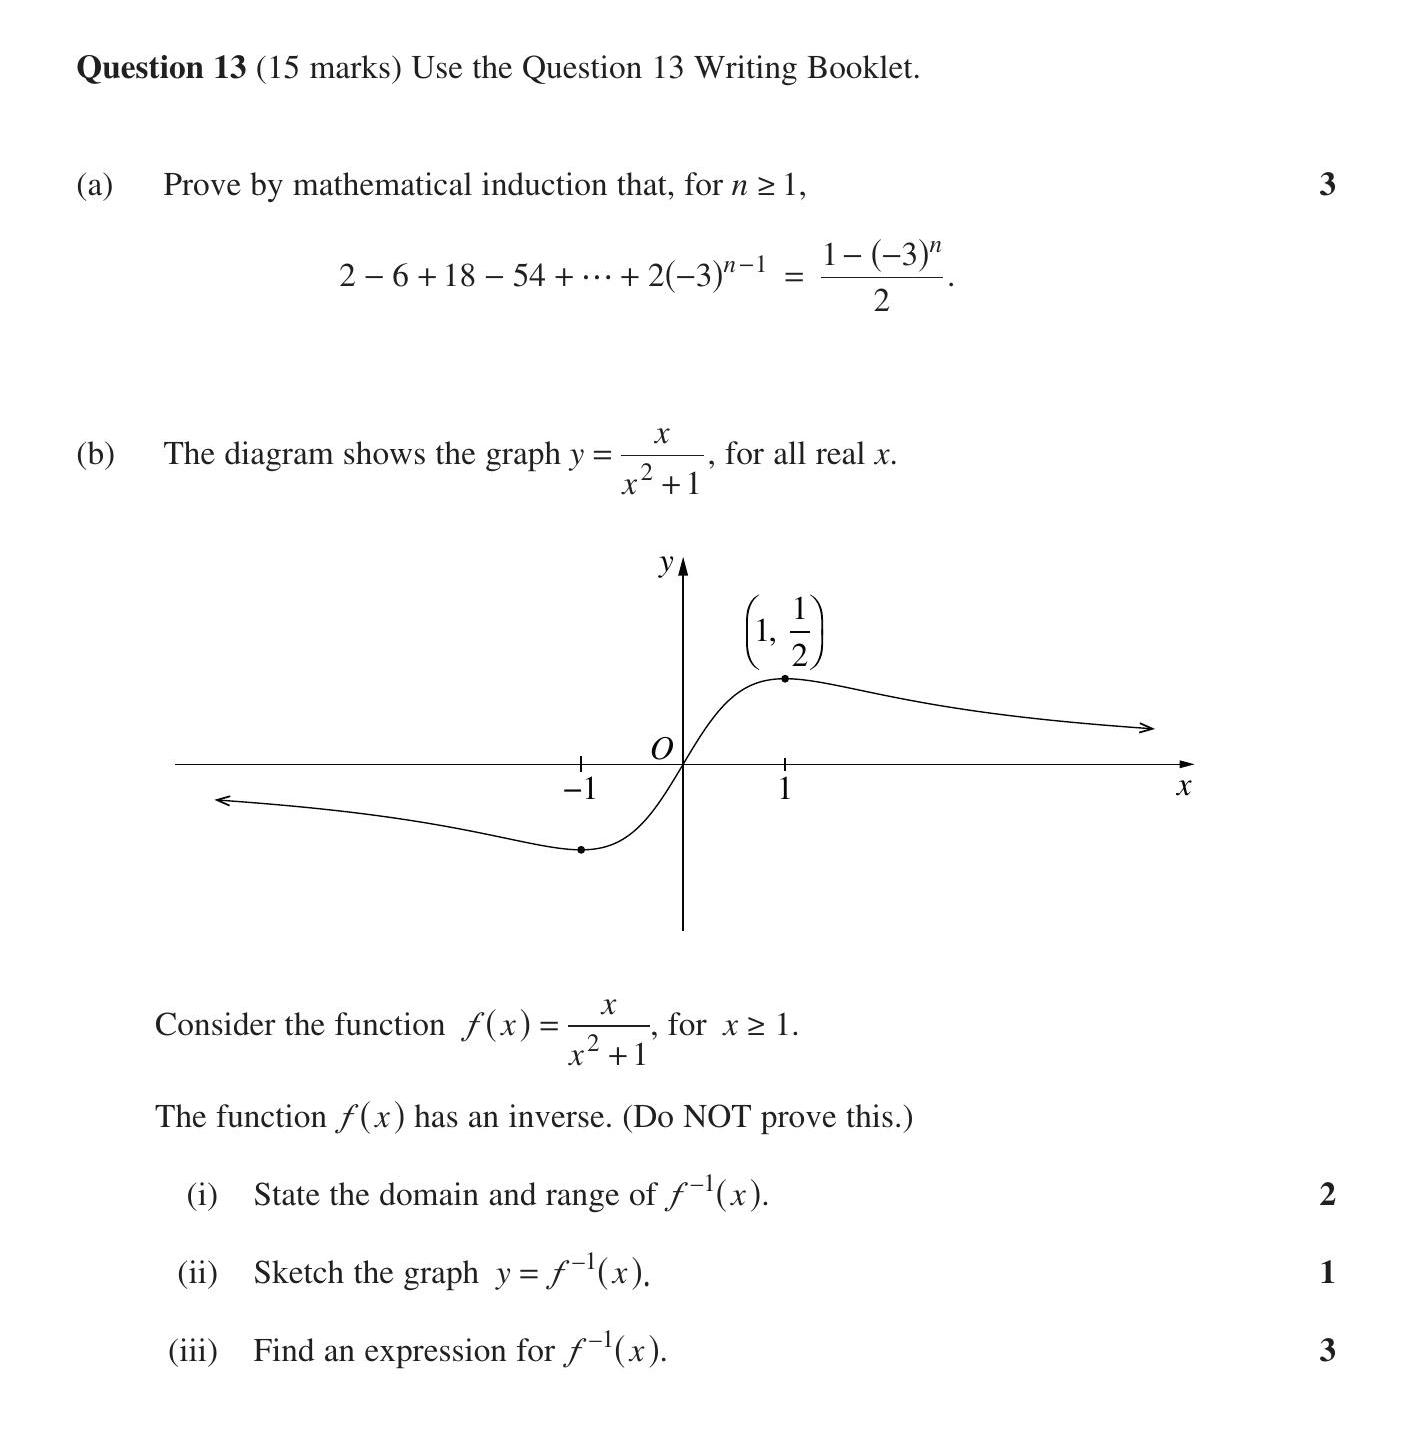
Prove by mathematical induction that, for n ≥ 1, 2 − 6 + 18 − 54 + ... + 2(−3)^{n−1} = \frac{1 − (−3)^{n}}{2}. The diagram shows the graph y = \frac{-x}{x^{2}+1}, ... show full transcript
Worked Solution & Example Answer:Prove by mathematical induction that, for n ≥ 1, 2 − 6 + 18 − 54 + .. - HSC - SSCE Mathematics Extension 1 - Question 13 - 2018 - Paper 1
Step 1
Prove by mathematical induction that, for n ≥ 1

Answer
To prove the equation by induction, we start with the base case where n=1:
Base Case (n=1):
LHS = 2 RHS = \frac{1 - (−3)^{1}}{2} = \frac{1 + 3}{2} = \frac{4}{2} = 2.
Thus, LHS = RHS, which holds true for n=1.
Inductive Step:
Assume true for n=k:
2 − 6 + 18 − 54 + ... + 2(−3)^{k−1} = \frac{1 − (−3)^{k}}{2}.
Prove for n=k+1:
LHS for n=k+1:
2 − 6 + 18 − 54 + ... + 2(−3)^{k−1} + 2(−3)^{k}.
Substituting the inductive hypothesis:
LHS = \frac{1 − (−3)^{k}}{2} + 2(−3)^{k}.
This simplifies to:
LHS = \frac{1 − (−3)^{k} + 4(−3)^{k}}{2} = \frac{1 + 3(-3)^{k}}{2}.
RHS for n=k+1:
\frac{1 − (−3)^{k+1}}{2} = \frac{1 + 3(-3)^{k}}{2}.
Since LHS = RHS, the statement holds for n=k+1. Hence, by induction, the statement is true for all n ≥ 1.
Step 2
State the domain and range of f^{−1}(x)
Answer
The function f(x) is defined for x ≥ 1. Thus, the domain of the inverse function f^{−1}(x) is:
- Domain: All real x, where x ≥ 0.
For the range, since the function f is decreasing on this interval, the range of f^{−1}(x) becomes:
- Range: All real y, where y ≥ -\frac{1}{2}.
Step 3
Sketch the graph y = f^{−1}(x)
Answer
To sketch the graph of f^{−1}(x), plot points based on the values derived from the function and reflect the behavior of f(x).
- Start with the intercepts and behavior at the extremes (e.g., when x=0, find y).
- Mark key points like (0, -\frac{1}{2}) and use the shape of f(x) to guide the sketch.
Ensure to indicate the asymptotic behavior and the overall decreasing nature of the graph.
Step 4
Find an expression for f^{−1}(x)
Answer
To find the inverse of the function f(x) = \frac{-x}{x^{2}+1}, follow these steps:
-
Replace f(x) with y: [ y = \frac{-x}{x^{2}+1} ]
-
Solve for x in terms of y. Rearranging gives: [ y(x^{2}+1) = -x ]
Absolute rearrangement leads us to: [ yx^{2} + y + x = 0 ]
-
Solve this quadratic equation using the quadratic formula: [ x = \frac{-b \pm \sqrt{b^{2} - 4ac}}{2a} ] where a = y, b = 1, c = y. The key simplification yields:
[ f^{−1}(x) = \frac{-1 + \sqrt{1 - 4y^{2}}}{2y} ]
This yields the expression for the inverse function f^{−1}(x).