Photo AI
The diagram shows a pH curve produced by adding a strong alkali to a weak acid - AQA - A-Level Chemistry - Question 22 - 2017 - Paper 3
Question 22
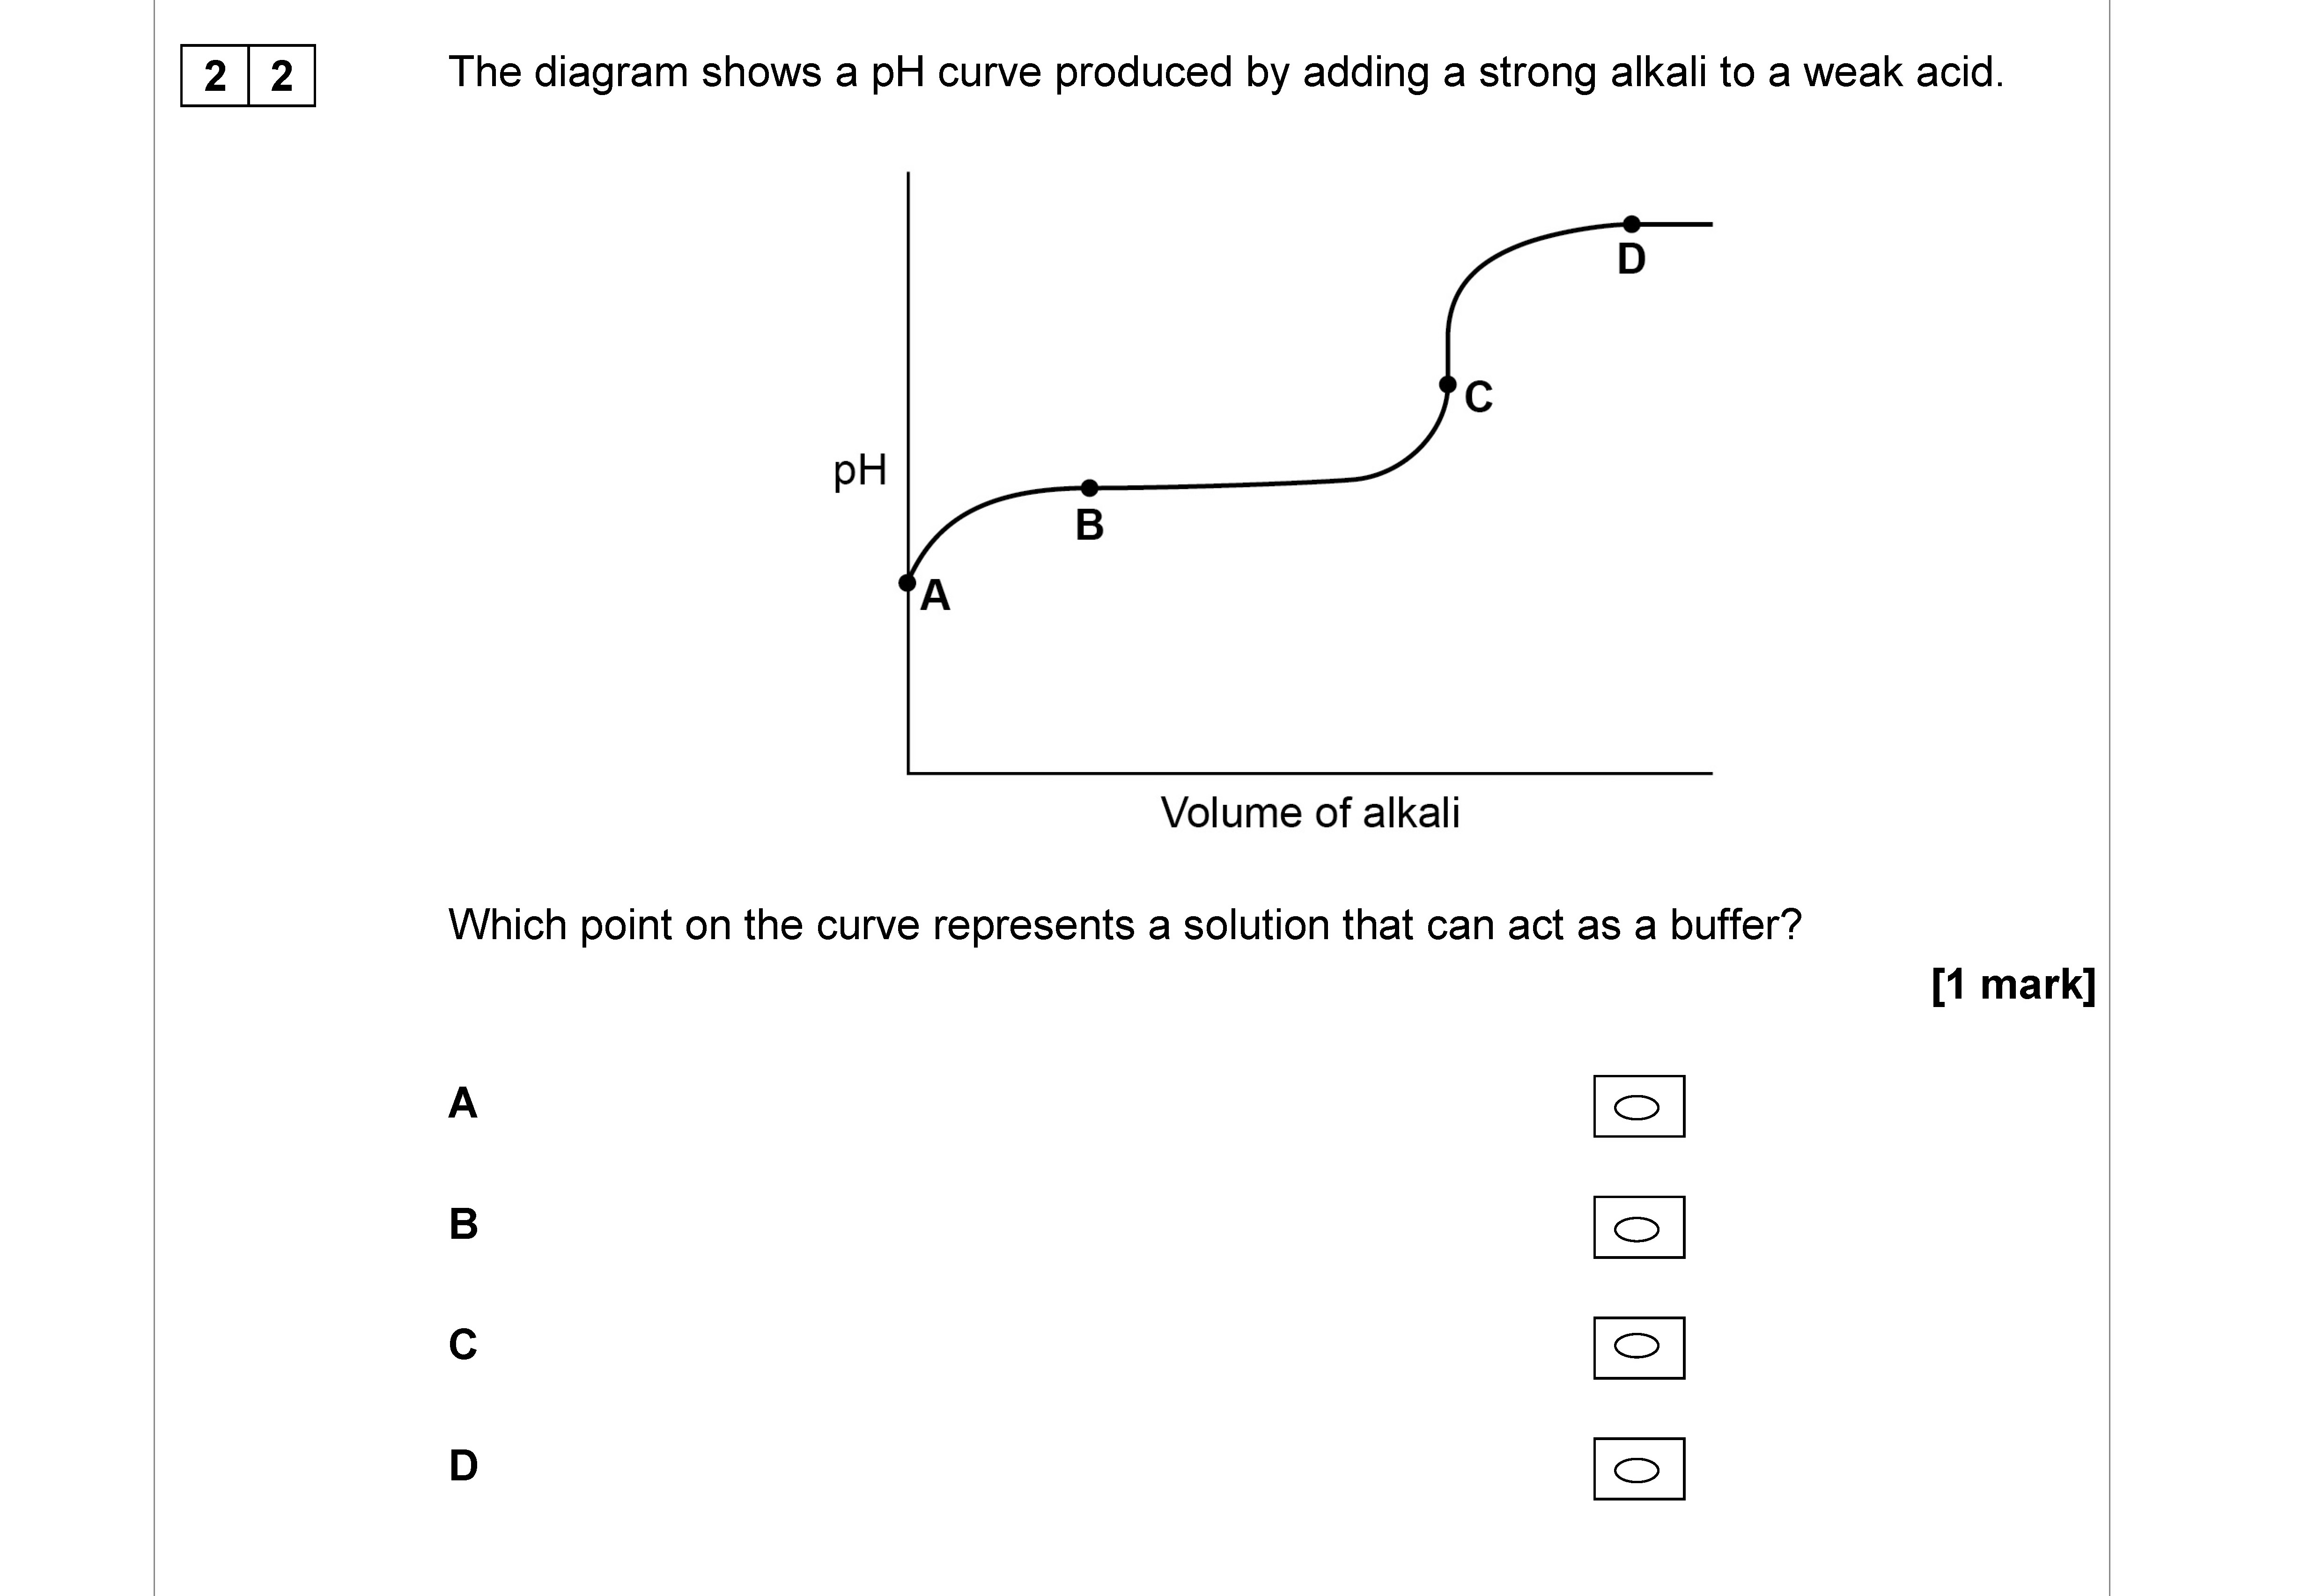
The diagram shows a pH curve produced by adding a strong alkali to a weak acid. Which point on the curve represents a solution that can act as a buffer? A B C D
Worked Solution & Example Answer:The diagram shows a pH curve produced by adding a strong alkali to a weak acid - AQA - A-Level Chemistry - Question 22 - 2017 - Paper 3
Step 1
Which point on the curve represents a solution that can act as a buffer?

Answer
A buffer solution is typically found at the point where the solution is at approximately halfway to the equivalence point in a titration curve. This corresponds to point B on the pH curve. At point B, there are significant amounts of both the weak acid and its conjugate base present, allowing the solution to resist changes in pH when acids or bases are added.