Photo AI
The graph below models the velocity of a small train as it moves on a straight track for 20 seconds - AQA - A-Level Maths Mechanics - Question 14 - 2017 - Paper 2
Question 14
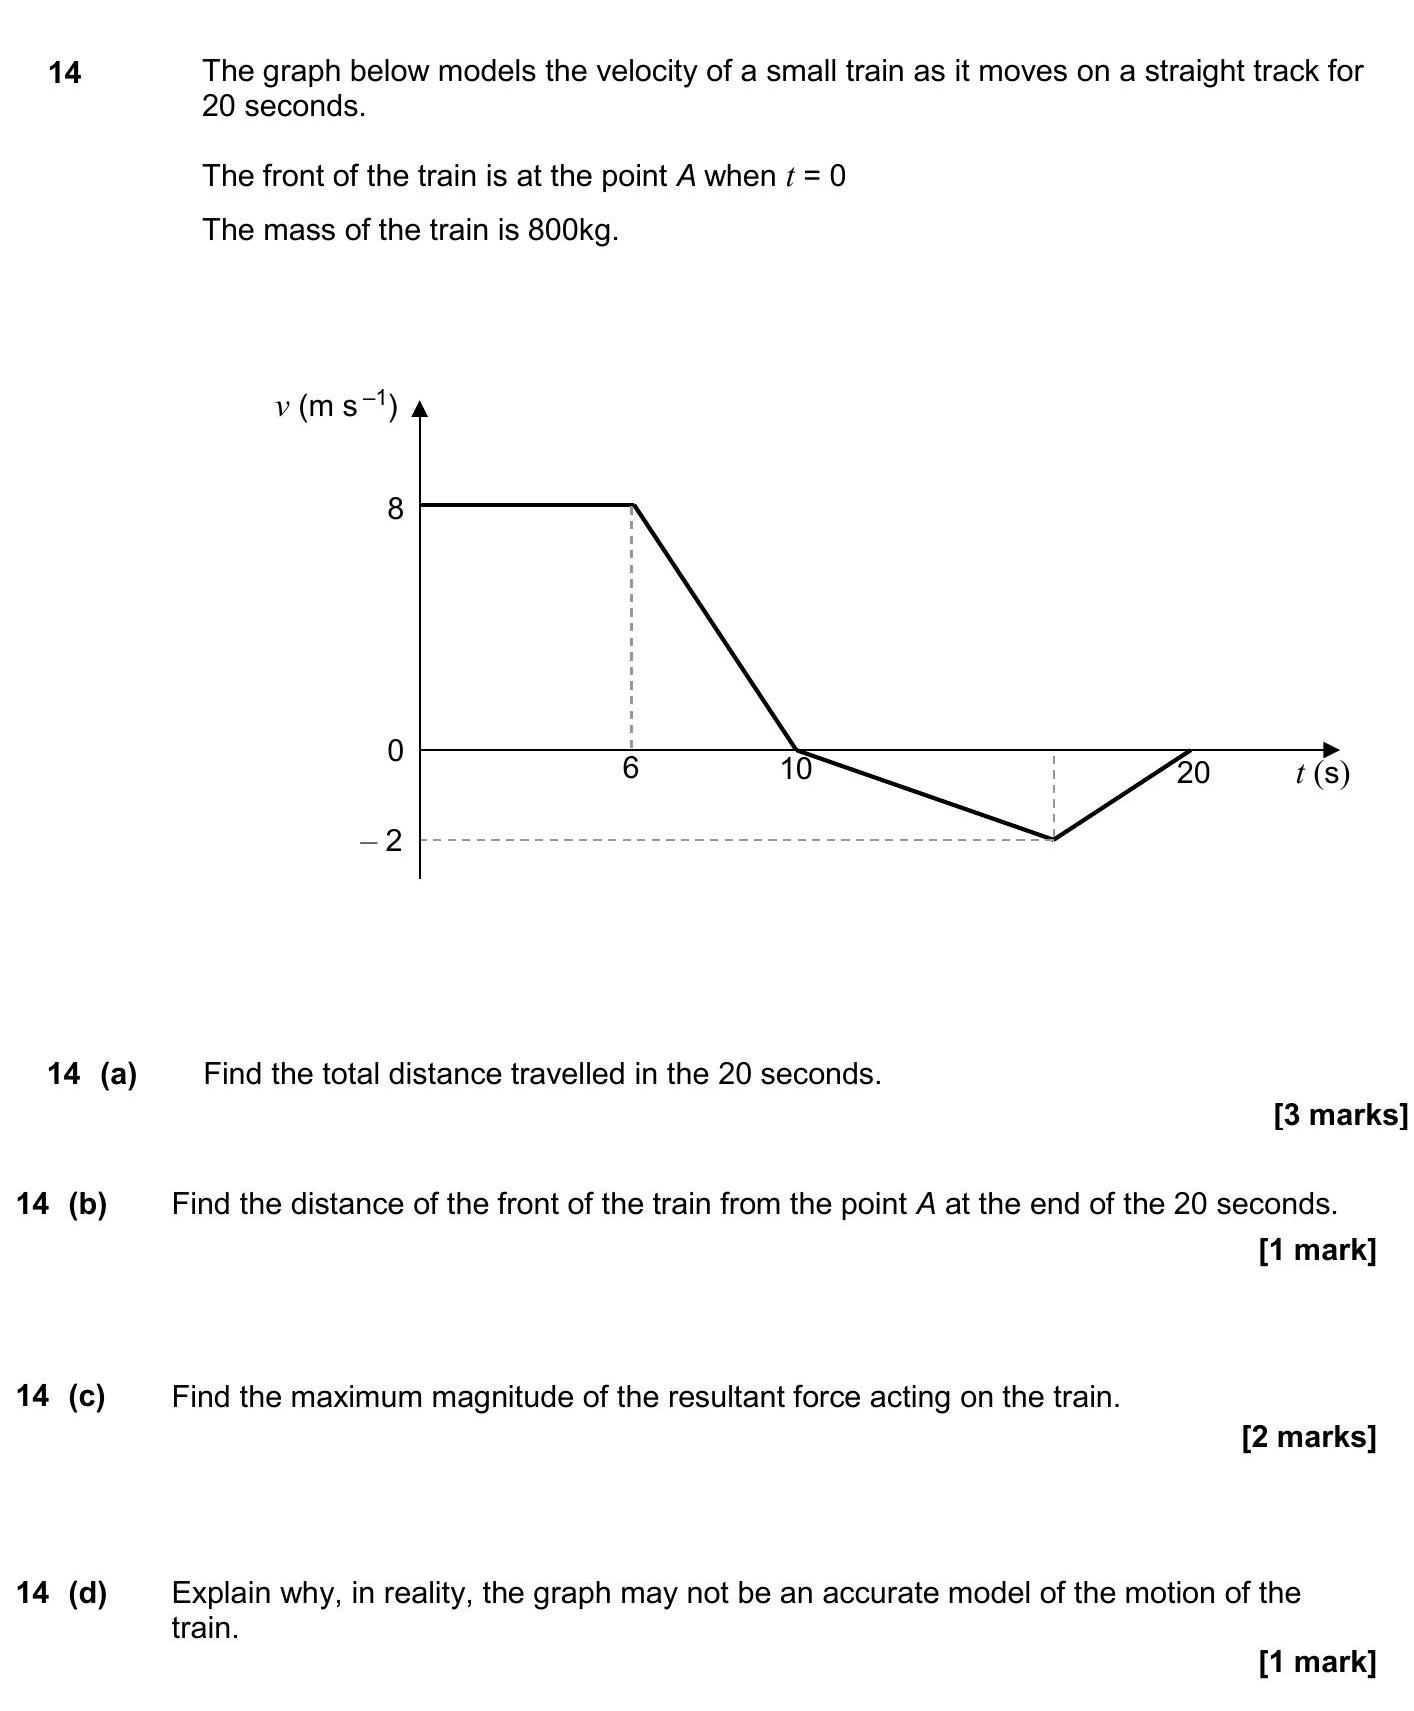
The graph below models the velocity of a small train as it moves on a straight track for 20 seconds. The front of the train is at the point A when t = 0 The mass o... show full transcript
Worked Solution & Example Answer:The graph below models the velocity of a small train as it moves on a straight track for 20 seconds - AQA - A-Level Maths Mechanics - Question 14 - 2017 - Paper 2
Step 1

Step 2
Step 3
14 (c) Find the maximum magnitude of the resultant force acting on the train.
Answer
Using Newton's second law, we calculate the maximum acceleration (deceleration) of the train between 6 to 10 seconds:
-
Acceleration (a) = Change in Velocity / Time = (0 - 8) m/s / 4 s = -2 m/s² (deceleration)
-
Now, using F = ma, where m is the mass of the train = 800 kg:
- Maximum Force (F) = 800 kg × 2 m/s² = 1600 N.
Step 4
14 (d) Explain why, in reality, the graph may not be an accurate model of the motion of the train.
Answer
In reality, the graph may not accurately represent the motion of the train because:
- Abrupt changes in velocity, as shown in the graph, are unlikely in real-world scenarios. Trains typically accelerate and decelerate gradually.
- The straight lines indicate constant velocity or instantaneous changes which do not account for the natural dynamics of train motion.