The graph below models the velocity of a small train as it moves on a straight track for 20 seconds - AQA - A-Level Maths Mechanics - Question 14 - 2017 - Paper 2
Question 14
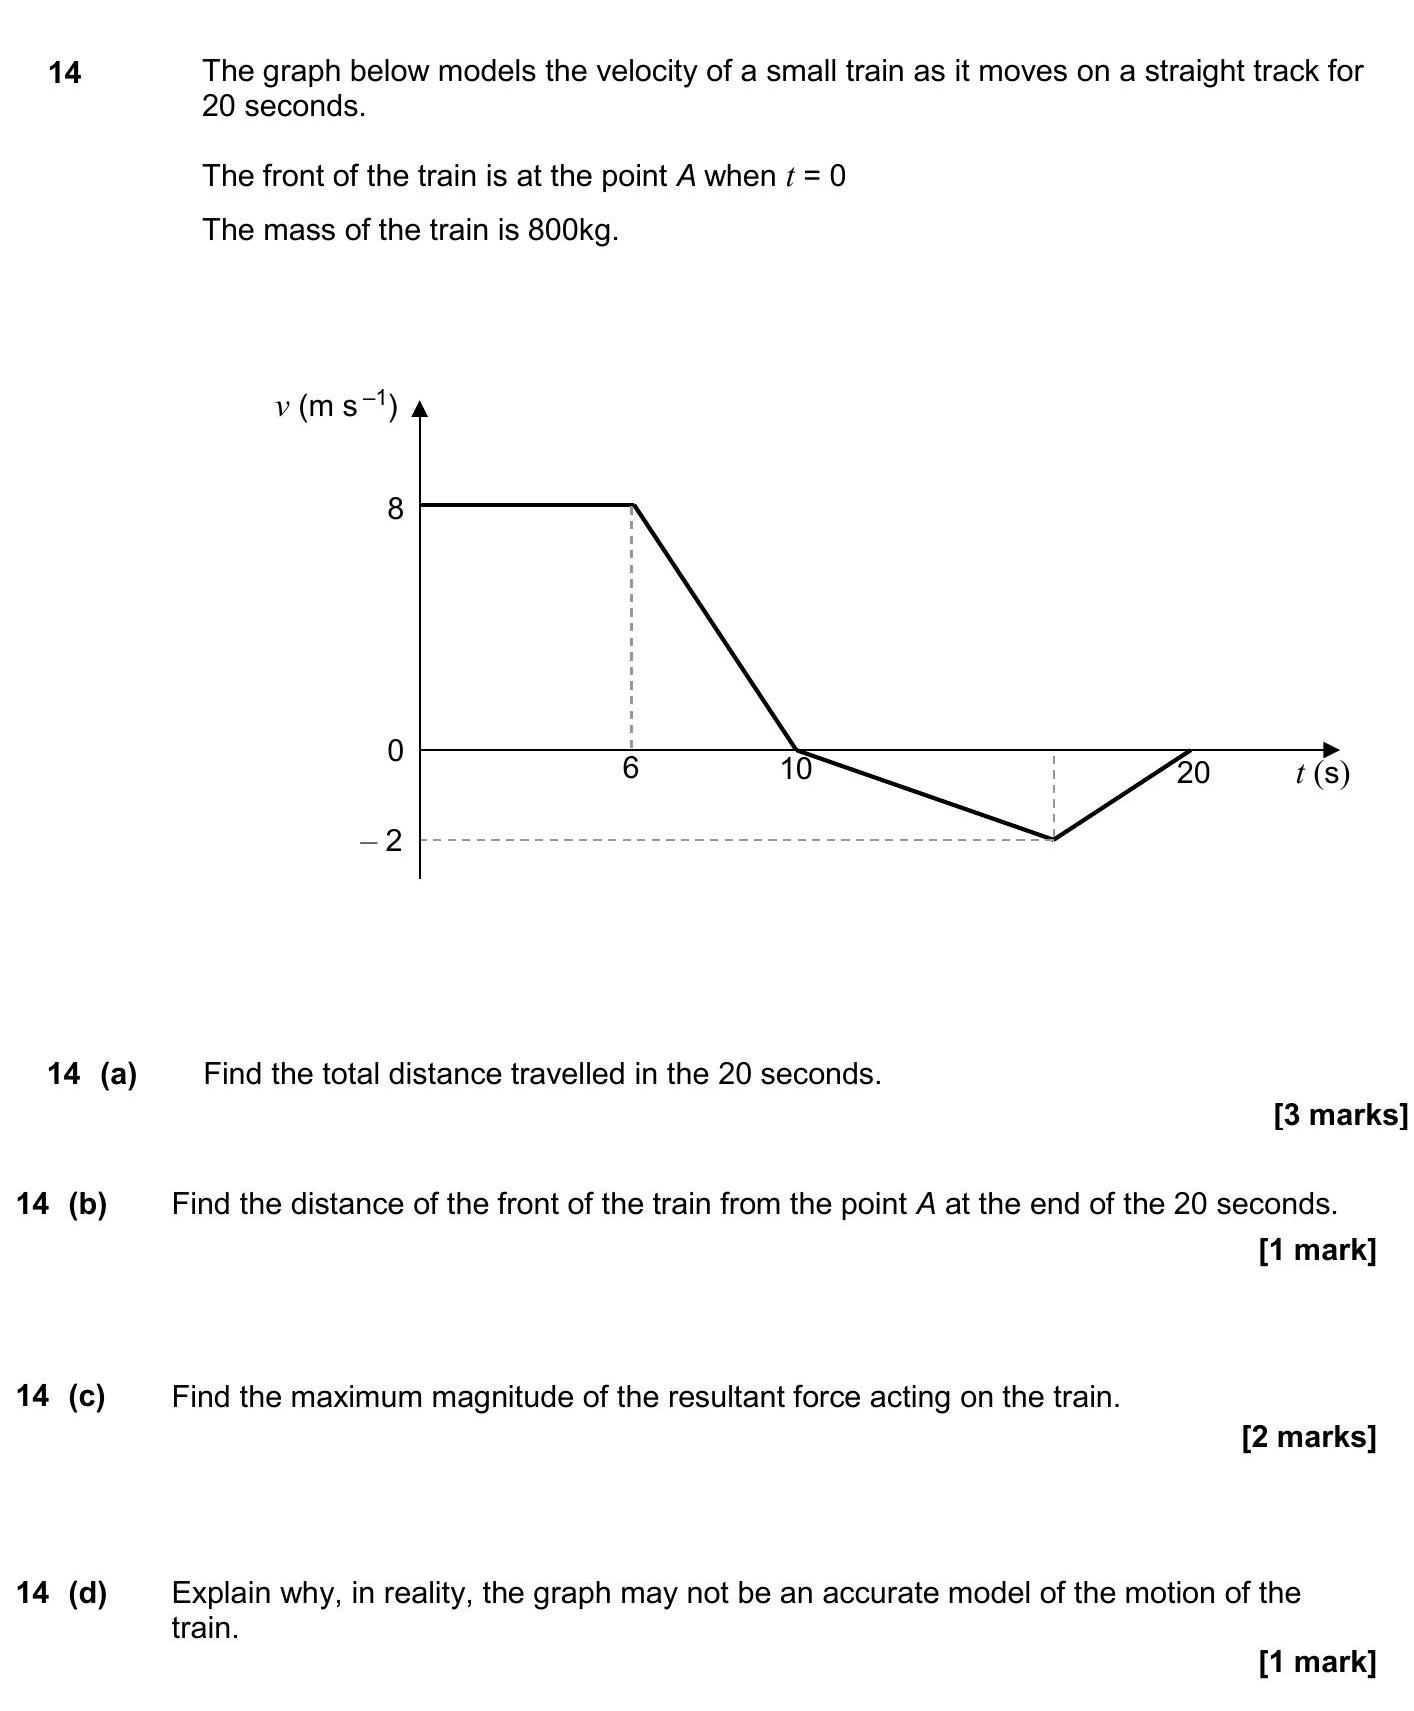
The graph below models the velocity of a small train as it moves on a straight track for 20 seconds.
The front of the train is at the point A when t = 0
The mass o... show full transcript
Worked Solution & Example Answer:The graph below models the velocity of a small train as it moves on a straight track for 20 seconds - AQA - A-Level Maths Mechanics - Question 14 - 2017 - Paper 2
Step 1
Find the total distance travelled in the 20 seconds.
96%
114 rated
Only available for registered users.
Sign up now to view full answer, or log in if you already have an account!
Answer
To calculate the total distance travelled, we can use the area under the velocity-time graph. The graph has three distinct sections:
Acceleration phase: From t = 0 to t = 8 seconds (velocity from 0 to 8 m/s)
The area is a triangle:
S1=21×base×height=21×8×8=32 m
Constant velocity phase: From t = 8 to t = 16 seconds (velocity of 8 m/s)
The area is a rectangle:
S2=base×height=8×8=64 m
Deceleration phase: From t = 16 to t = 20 seconds (velocity from 8 m/s to 0 m/s)
The area is a trapezium (or a triangle since the final velocity is zero):
S3=21×base×(height1+height2)=21×4×(8+0)=16 m
Now, adding these areas together gives:
Total distance=S1+S2+S3=32+64+16=112 m
Step 2
Find the distance of the front of the train from the point A at the end of the 20 seconds.
99%
104 rated
Only available for registered users.
Sign up now to view full answer, or log in if you already have an account!
Answer
At the end of 20 seconds, the distance from point A is the total distance travelled, which is 112 m.
Step 3
Find the maximum magnitude of the resultant force acting on the train.
96%
101 rated
Only available for registered users.
Sign up now to view full answer, or log in if you already have an account!
Answer
To find the maximum force, we first calculate the maximum acceleration of the train. The graph shows a change in velocity from 8 m/s to 0 m/s over the last 4 seconds:
amax=ΔtΔv=40−8=−2 m/s2
Next, we apply Newton's second law to find the resultant force:
Fmax=m×amax=800×(−2)=−1600 N
The maximum magnitude of the resultant force is therefore 1600 N.
Step 4
Explain why, in reality, the graph may not be an accurate model of the motion of the train.
98%
120 rated
Only available for registered users.
Sign up now to view full answer, or log in if you already have an account!
Answer
In reality, changes in velocity are unlikely to be instantaneous, as shown by the abrupt changes and straight lines in the graph. We would expect to see curves in the graph due to gradual acceleration and deceleration, rather than sharp transitions.