The probabilities of events A, B and C are related, as shown in the Venn diagram below - AQA - A-Level Maths Pure - Question 10 - 2020 - Paper 3
Question 10
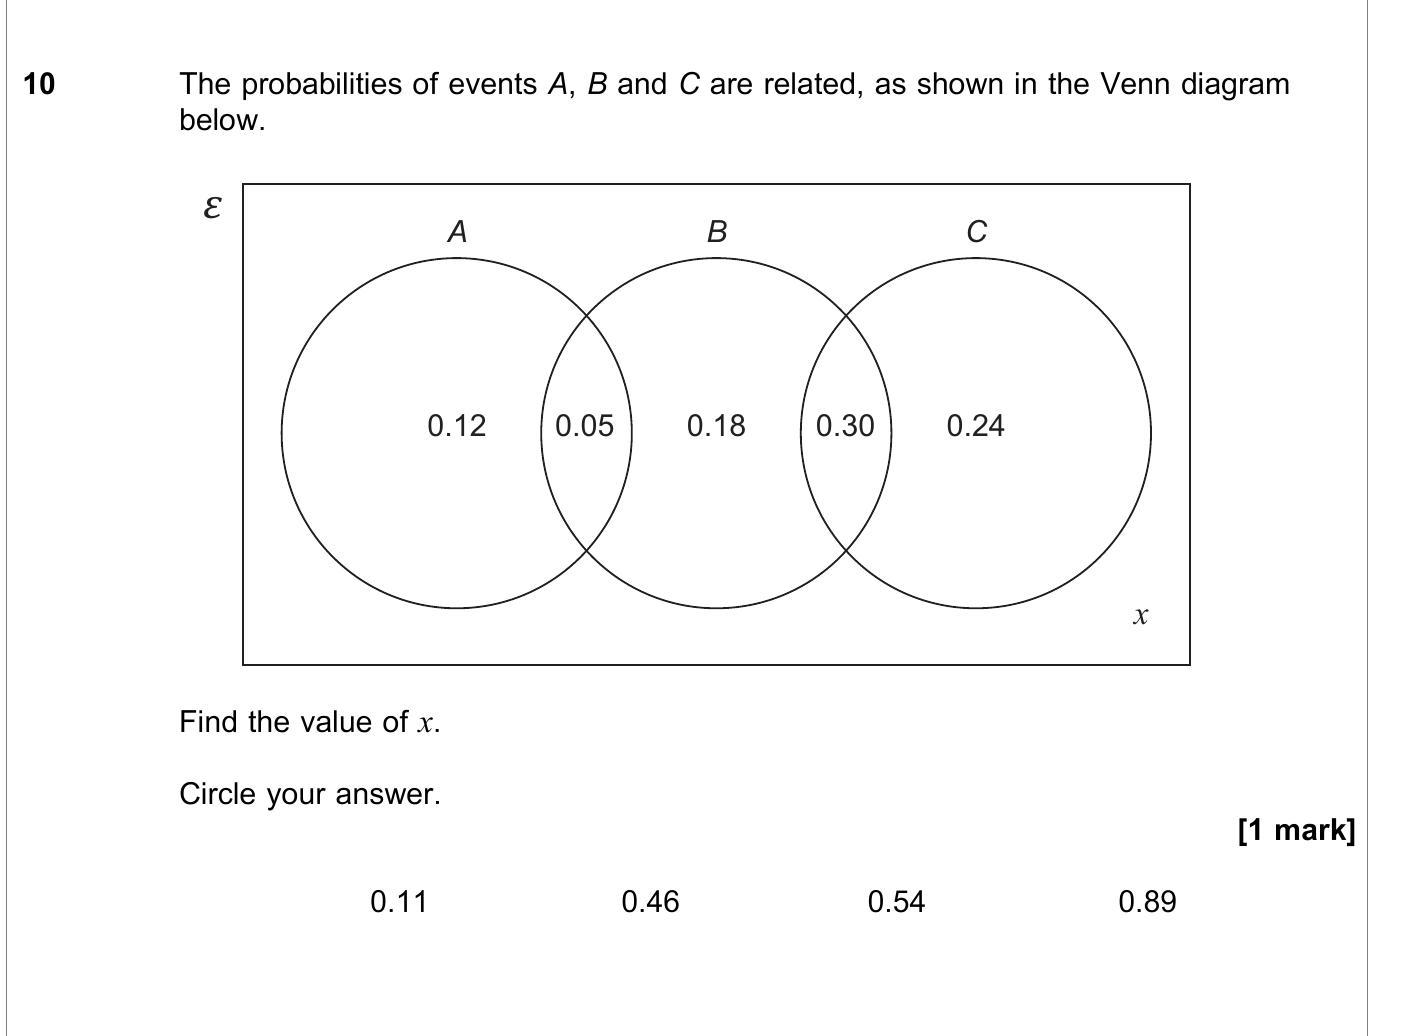
The probabilities of events A, B and C are related, as shown in the Venn diagram below.
$\varepsilon$
A
0.12
B
0.05
0.18
0.30
C
0.24
Find the value of x.
... show full transcript
Worked Solution & Example Answer:The probabilities of events A, B and C are related, as shown in the Venn diagram below - AQA - A-Level Maths Pure - Question 10 - 2020 - Paper 3
Step 1
Find the total probability in the Venn diagram
96%
114 rated
Only available for registered users.
Sign up now to view full answer, or log in if you already have an account!
Answer
The total probability for all events A, B, and C (including overlap) must equal 1. We can summarize what we have in the Venn diagram:
P(A)+P(B)+P(C)+P(A∩B)+P(B∩C)+P(C∩A)+P(A∩B∩C)+x=1
Where:
P(A)=0.12 (only A)
P(B)=0.05 (only B)
P(C)=0.24 (only C)
P(A∩B)=0.18
P(B∩C)=0.30
Plugging in these values:
0.12+0.05+0.24+0.18+0.30+x=1
Step 2
Calculate the remaining probability for x
99%
104 rated
Only available for registered users.
Sign up now to view full answer, or log in if you already have an account!
Answer
Adding the known probabilities:
0.12+0.05+0.24+0.18+0.30=0.89
So we have:
0.89+x=1
Subtracting 0.89 from both sides gives:
x=1−0.89x=0.11
Step 3
Circle your answer
96%
101 rated
Only available for registered users.
Sign up now to view full answer, or log in if you already have an account!
Answer
The value of x is 0.11. The correct answer to circle is: