Photo AI
The table below shows the annual global production of plastics, P, measured in millions of tonnes per year, for six selected years - AQA - A-Level Maths Pure - Question 9 - 2021 - Paper 1
Question 9
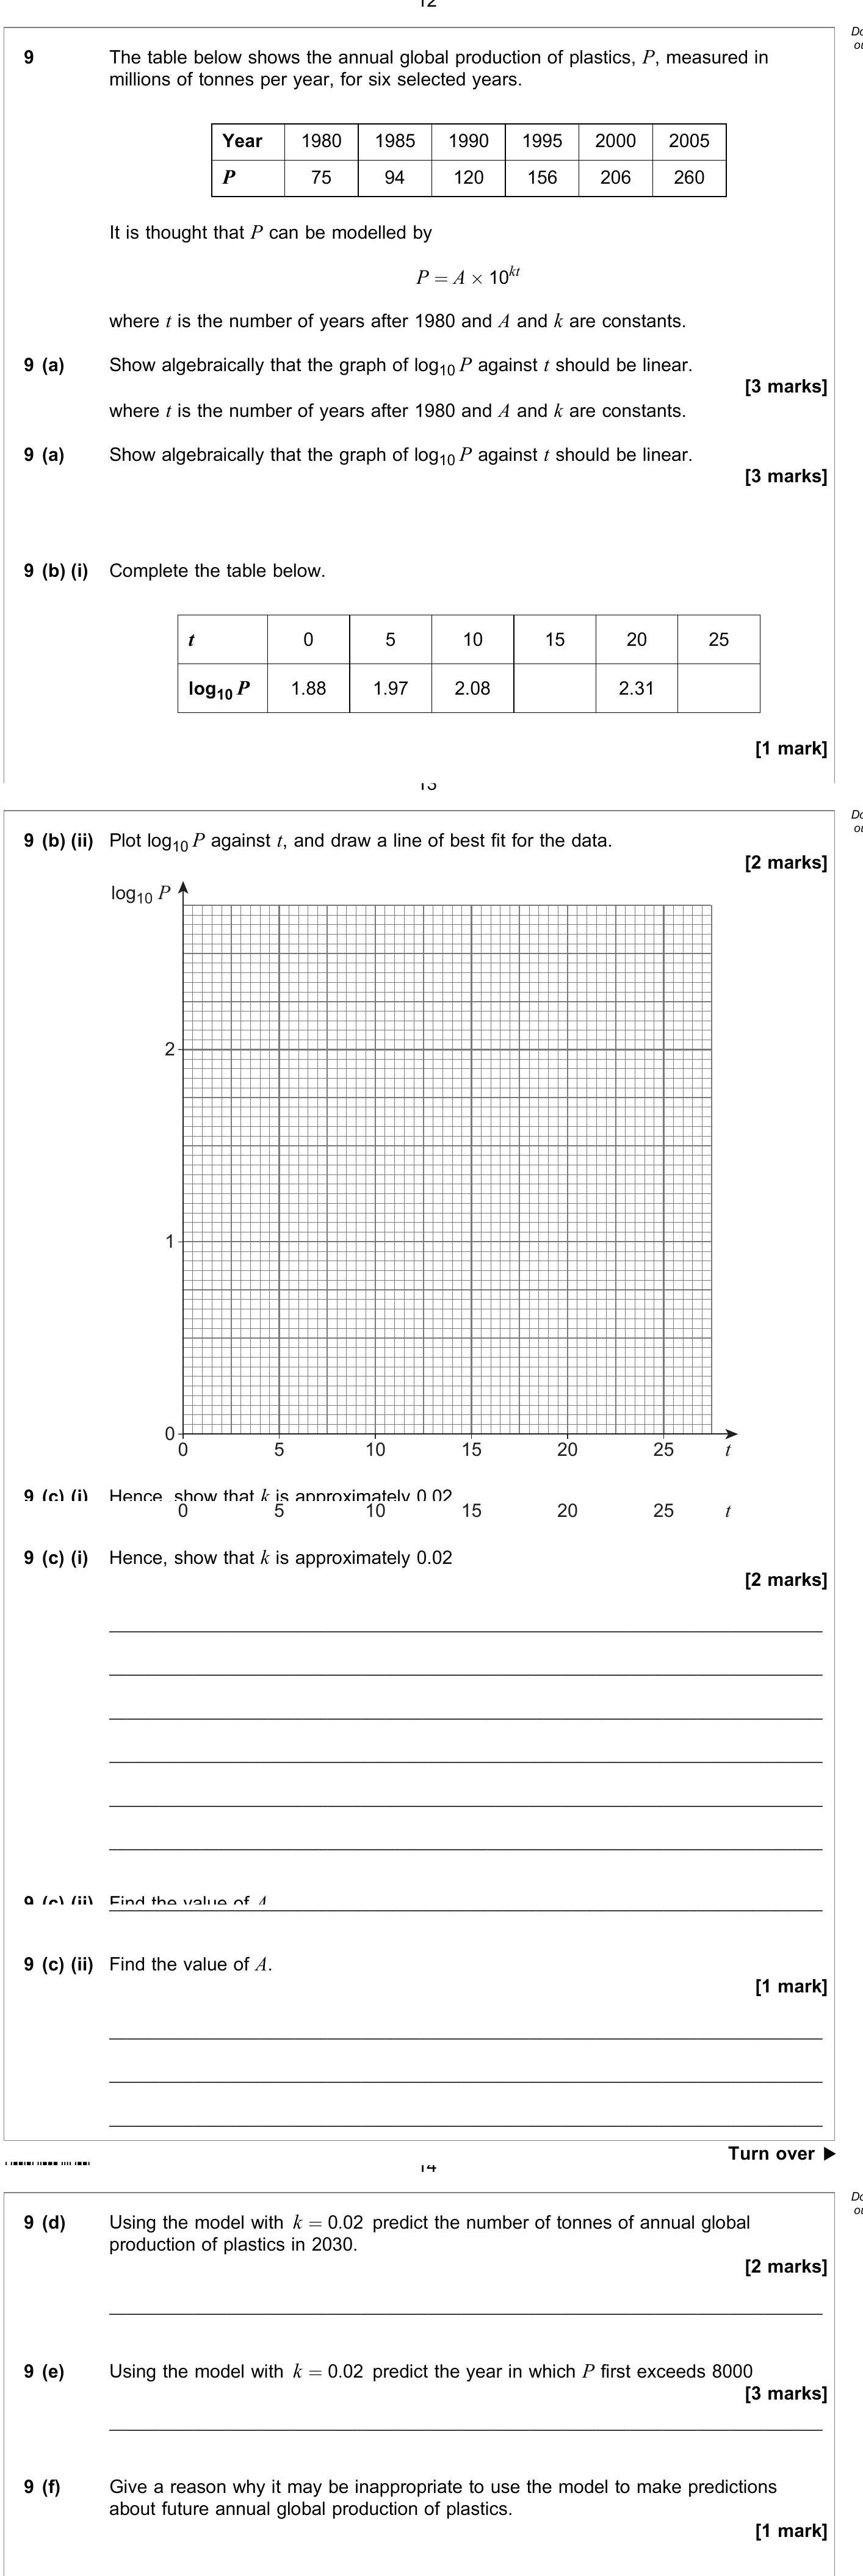
The table below shows the annual global production of plastics, P, measured in millions of tonnes per year, for six selected years. Year 1980 1985 1990 ... show full transcript
Worked Solution & Example Answer:The table below shows the annual global production of plastics, P, measured in millions of tonnes per year, for six selected years - AQA - A-Level Maths Pure - Question 9 - 2021 - Paper 1
Step 1
Show algebraically that the graph of log_{10} P against t should be linear.

Answer
Starting with the initial model, we have:
Taking the logarithm on both sides gives us:
Using logarithmic properties, this can be expressed as:
This represents a linear equation of the form:
where the y-intercept is ( \log_{10} A ) and the slope is ( k ). Hence, it shows that the graph of ( \log_{10} P ) against ( t ) should indeed be linear.
Step 2
Step 3
Step 4
Step 5
Step 6
Step 7
Give a reason why it may be inappropriate to use the model to make predictions about future annual global production of plastics.
Answer
The model may be inappropriate because it assumes a constant growth rate. In reality, external factors such as regulations, technology advancements, and shifts in consumer behavior can significantly alter production rates, making the linear model less reliable in predicting future outcomes.