Photo AI
The function f is concave and is represented by one of the graphs below - AQA - A-Level Maths Pure - Question 3 - 2022 - Paper 2
Question 3
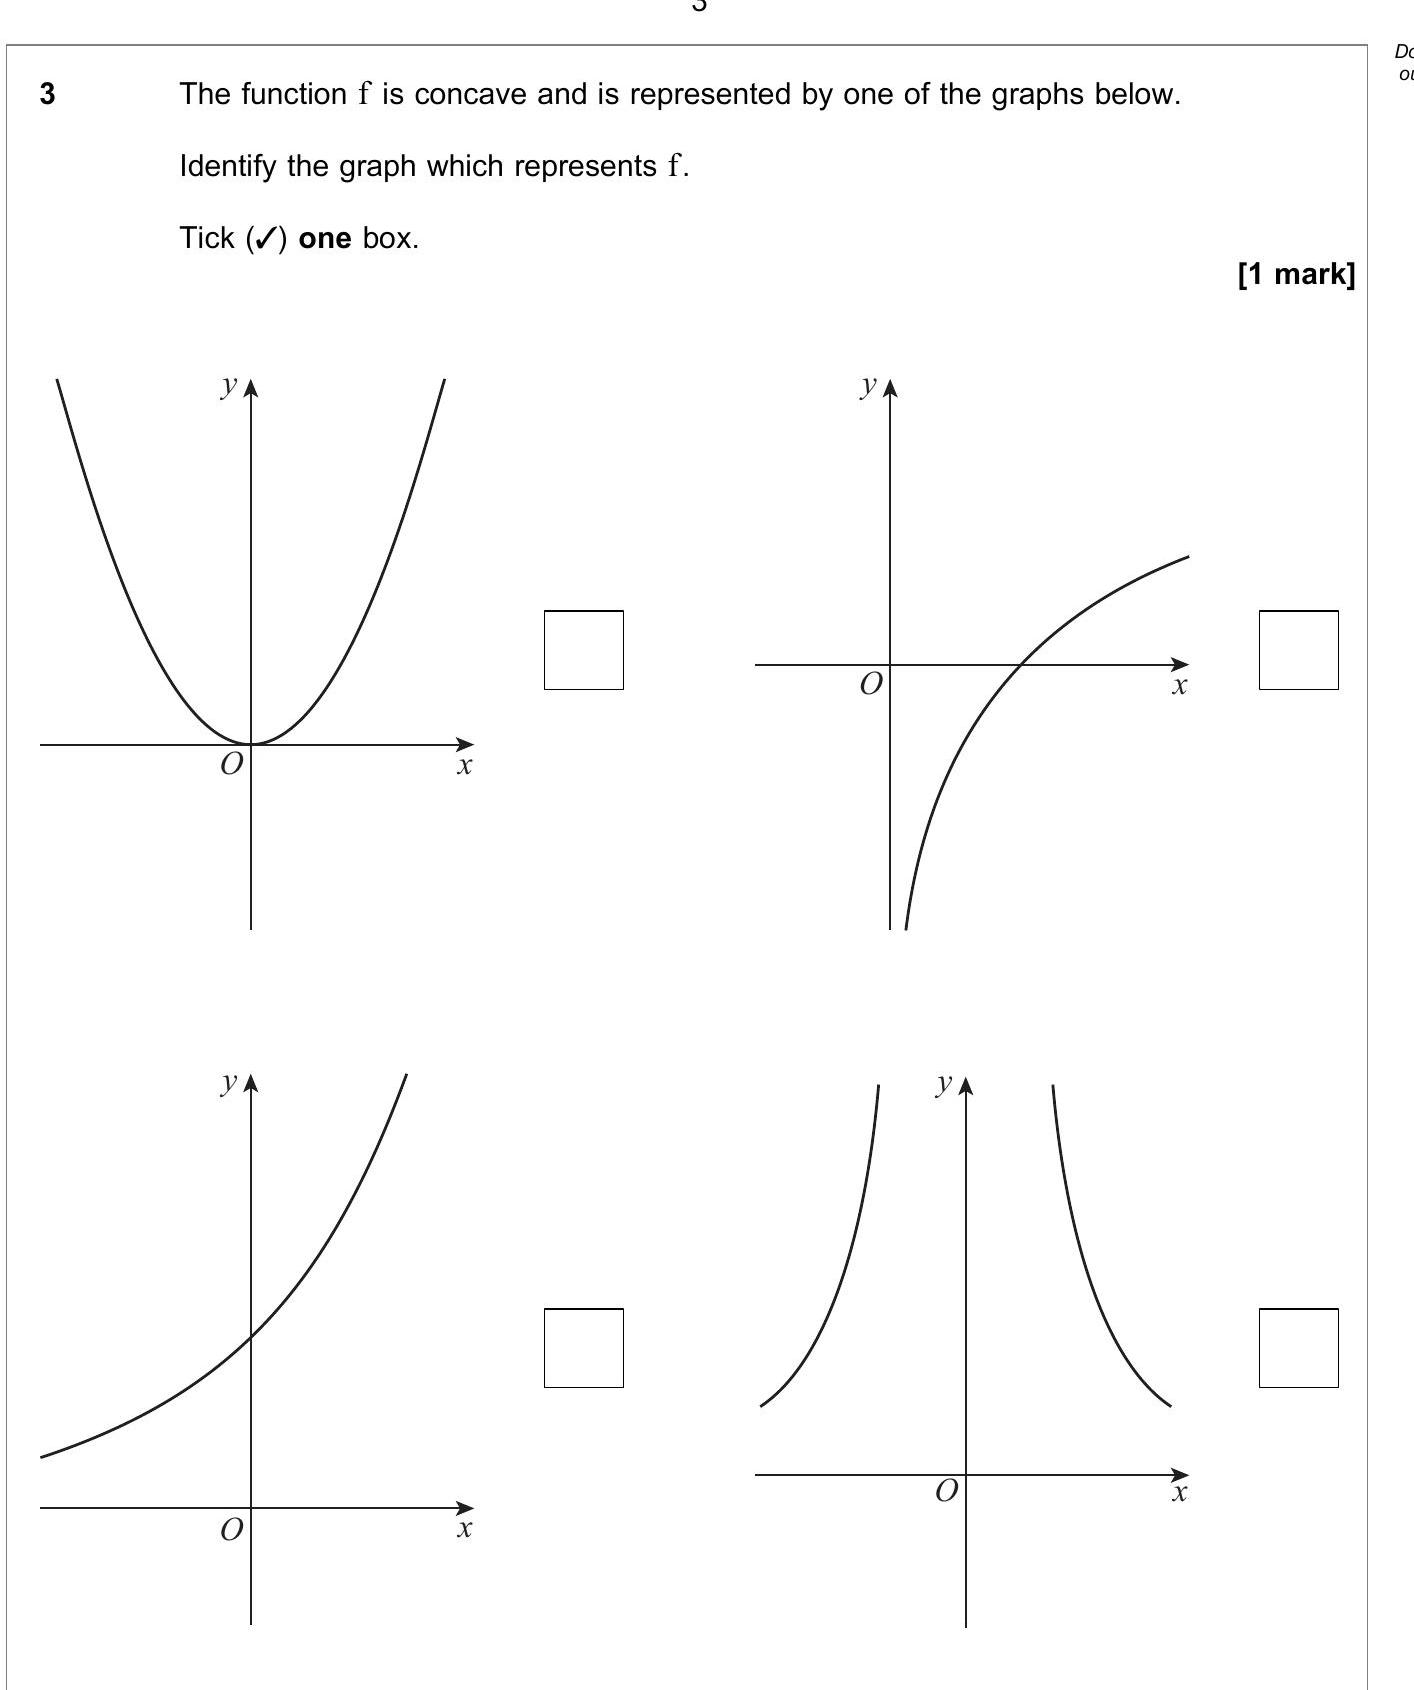
The function f is concave and is represented by one of the graphs below. Identify the graph which represents f. Tick (/) one box.
Worked Solution & Example Answer:The function f is concave and is represented by one of the graphs below - AQA - A-Level Maths Pure - Question 3 - 2022 - Paper 2
Step 1
Identify the graph which represents f

Answer
To determine which graph represents the concave function f, we need to understand the nature of concave functions. A function is said to be concave if its second derivative is less than or equal to zero throughout its domain. This implies that the graph of the function opens downwards, resembling the shape of an upside-down cup.
By examining the provided graphs:
- The first graph resembles a typical parabola opening upwards, indicating that it is not concave.
- The second graph indicates uncertainty in concavity as it does not follow a clear concave pattern.
- The third graph demonstrates an increasing function that shows concave behavior as it also curves downwards and flattens out.
- The fourth graph opens upwards like the first and also does not meet the concavity criteria.
Thus, the correct representation of function f, which is concave, is the third graph.