Photo AI
Figure 4 shows a block (subsystem) diagram for a radio communication system - AQA - A-Level Physics - Question 3 - 2018 - Paper 8
Question 3
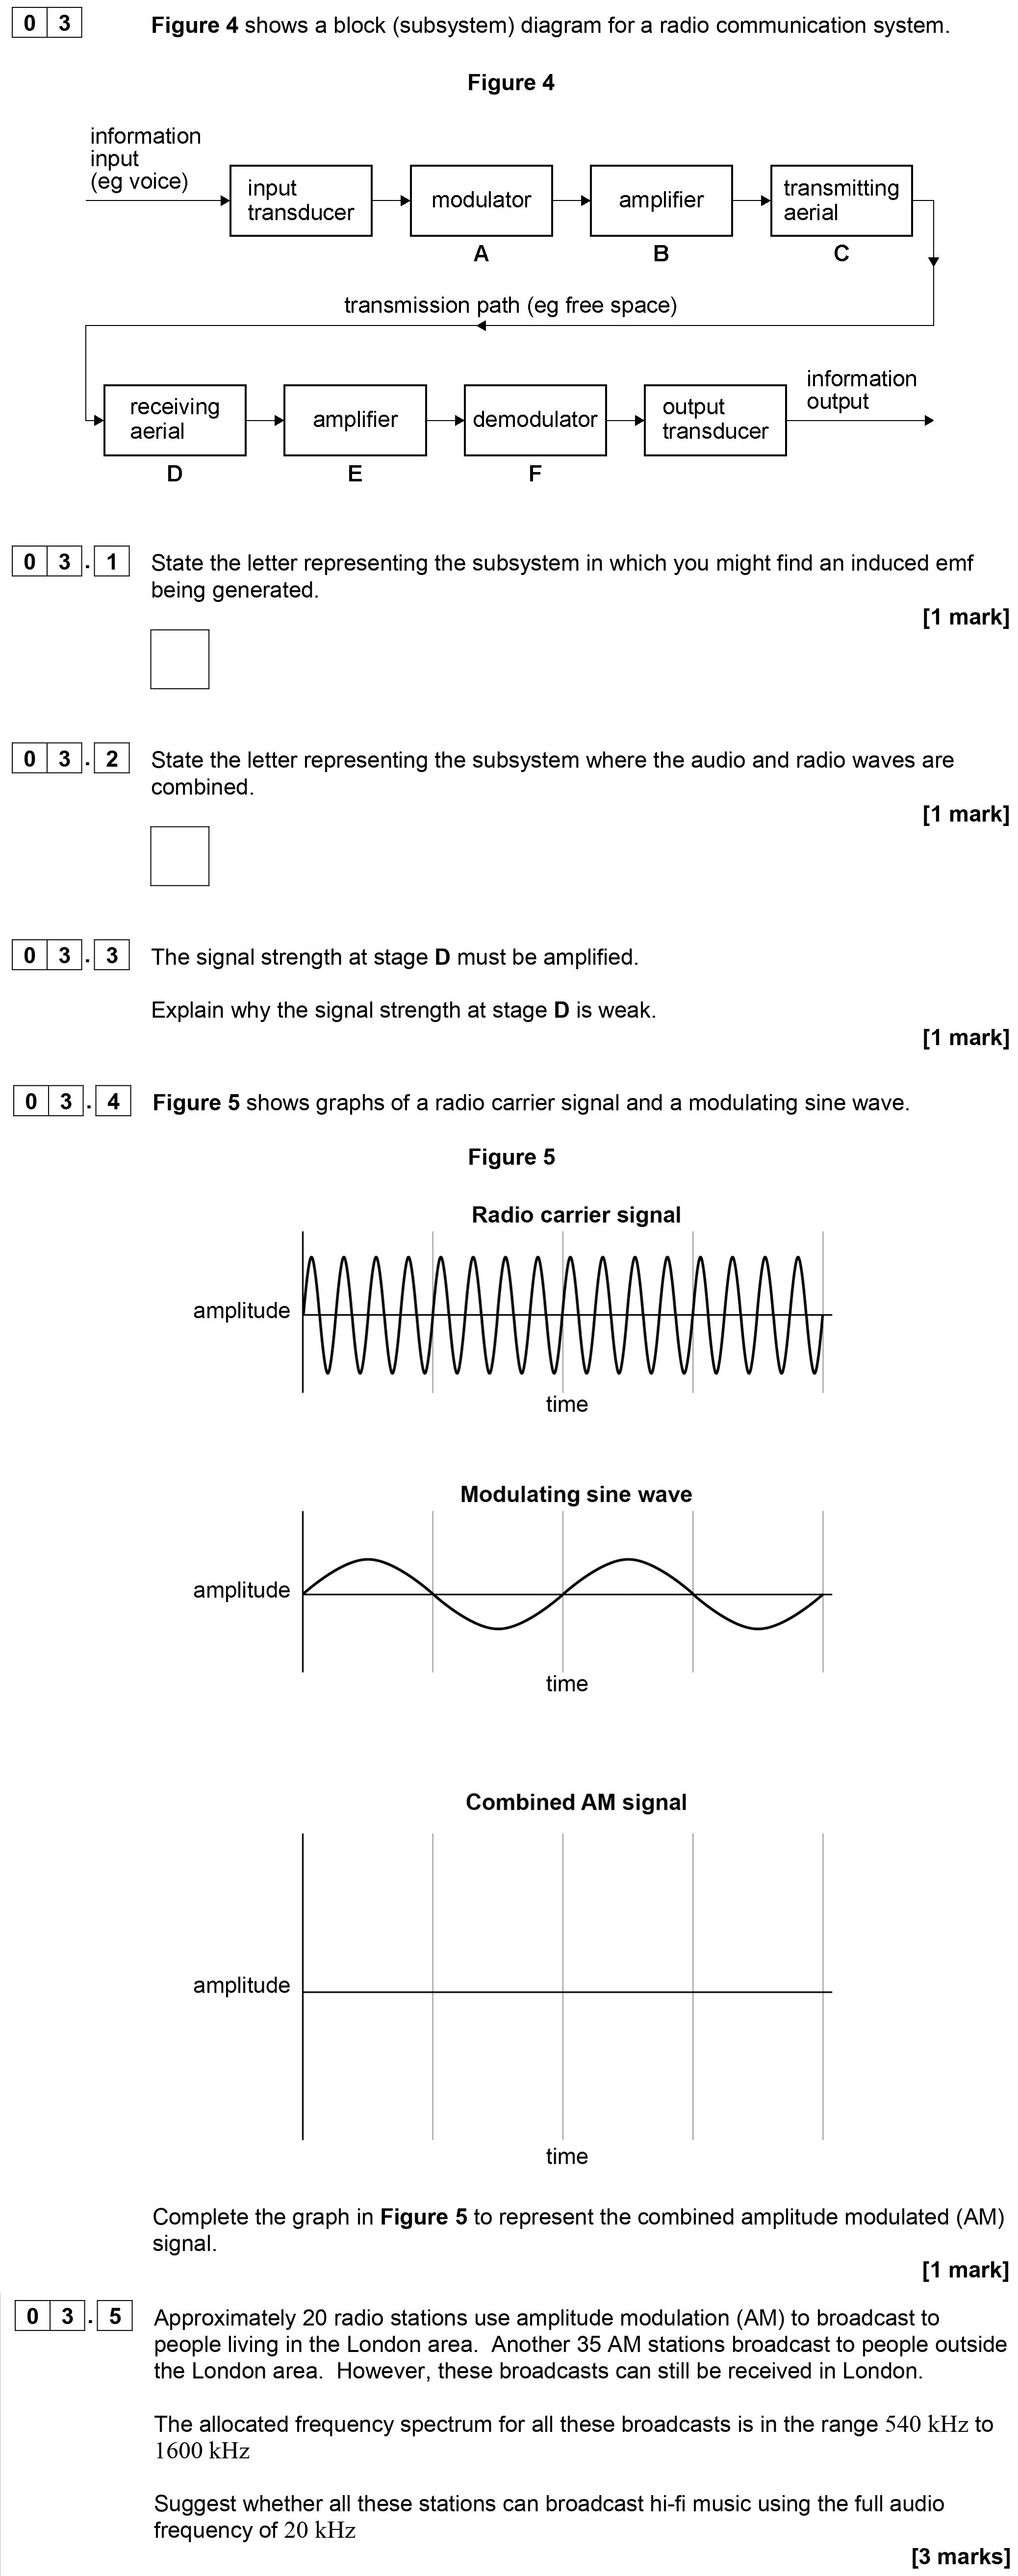
Figure 4 shows a block (subsystem) diagram for a radio communication system. Figure 4 information input (eg voice) -> input transducer -> modulator -> amplifier ->... show full transcript
Worked Solution & Example Answer:Figure 4 shows a block (subsystem) diagram for a radio communication system - AQA - A-Level Physics - Question 3 - 2018 - Paper 8
Step 1

Step 2
Step 3
Explain why the signal strength at stage D is weak.
Answer
The signal strength at stage D is weak due to several factors, including:
-
Attenuation: The electromagnetic (em) wave experiences attenuation as it travels across the transmission path, leading to a reduction in signal strength.
-
Reflection and Absorption: A small fraction of the radiated energy is lost through reflection from the ground or due to natural topography and atmospheric absorption, further weakening the signal.
Step 4
Complete the graph in Figure 5 to represent the combined amplitude modulated (AM) signal.
Answer
To represent the combined AM signal, the graph should illustrate the modulating signal form overlapping the carrier signal, thus creating an envelope that varies the amplitude of the carrier wave according to the modulating wave.
[Insert AM signal graph here that shows the correct positions in relation to the radio carrier and modulating sine wave in Figure 5.]
Step 5
Suggest whether all these stations can broadcast hi-fi music using the full audio frequency of 20 kHz.
Answer
To determine if all stations can broadcast hi-fi music using a full audio frequency of 20 kHz, we need to consider the frequency allocation. With the allocated band from 540 kHz to 1600 kHz, each station has a bandwidth of about 40 kHz available (calculated as follows: 1600 kHz - 540 kHz = 1060 kHz; divided by 55 stations gives about 40 kHz per station). Since the full audio frequency is 20 kHz, it is feasible for all stations to broadcast hi-fi music without interference, as each station has sufficient bandwidth allocated.