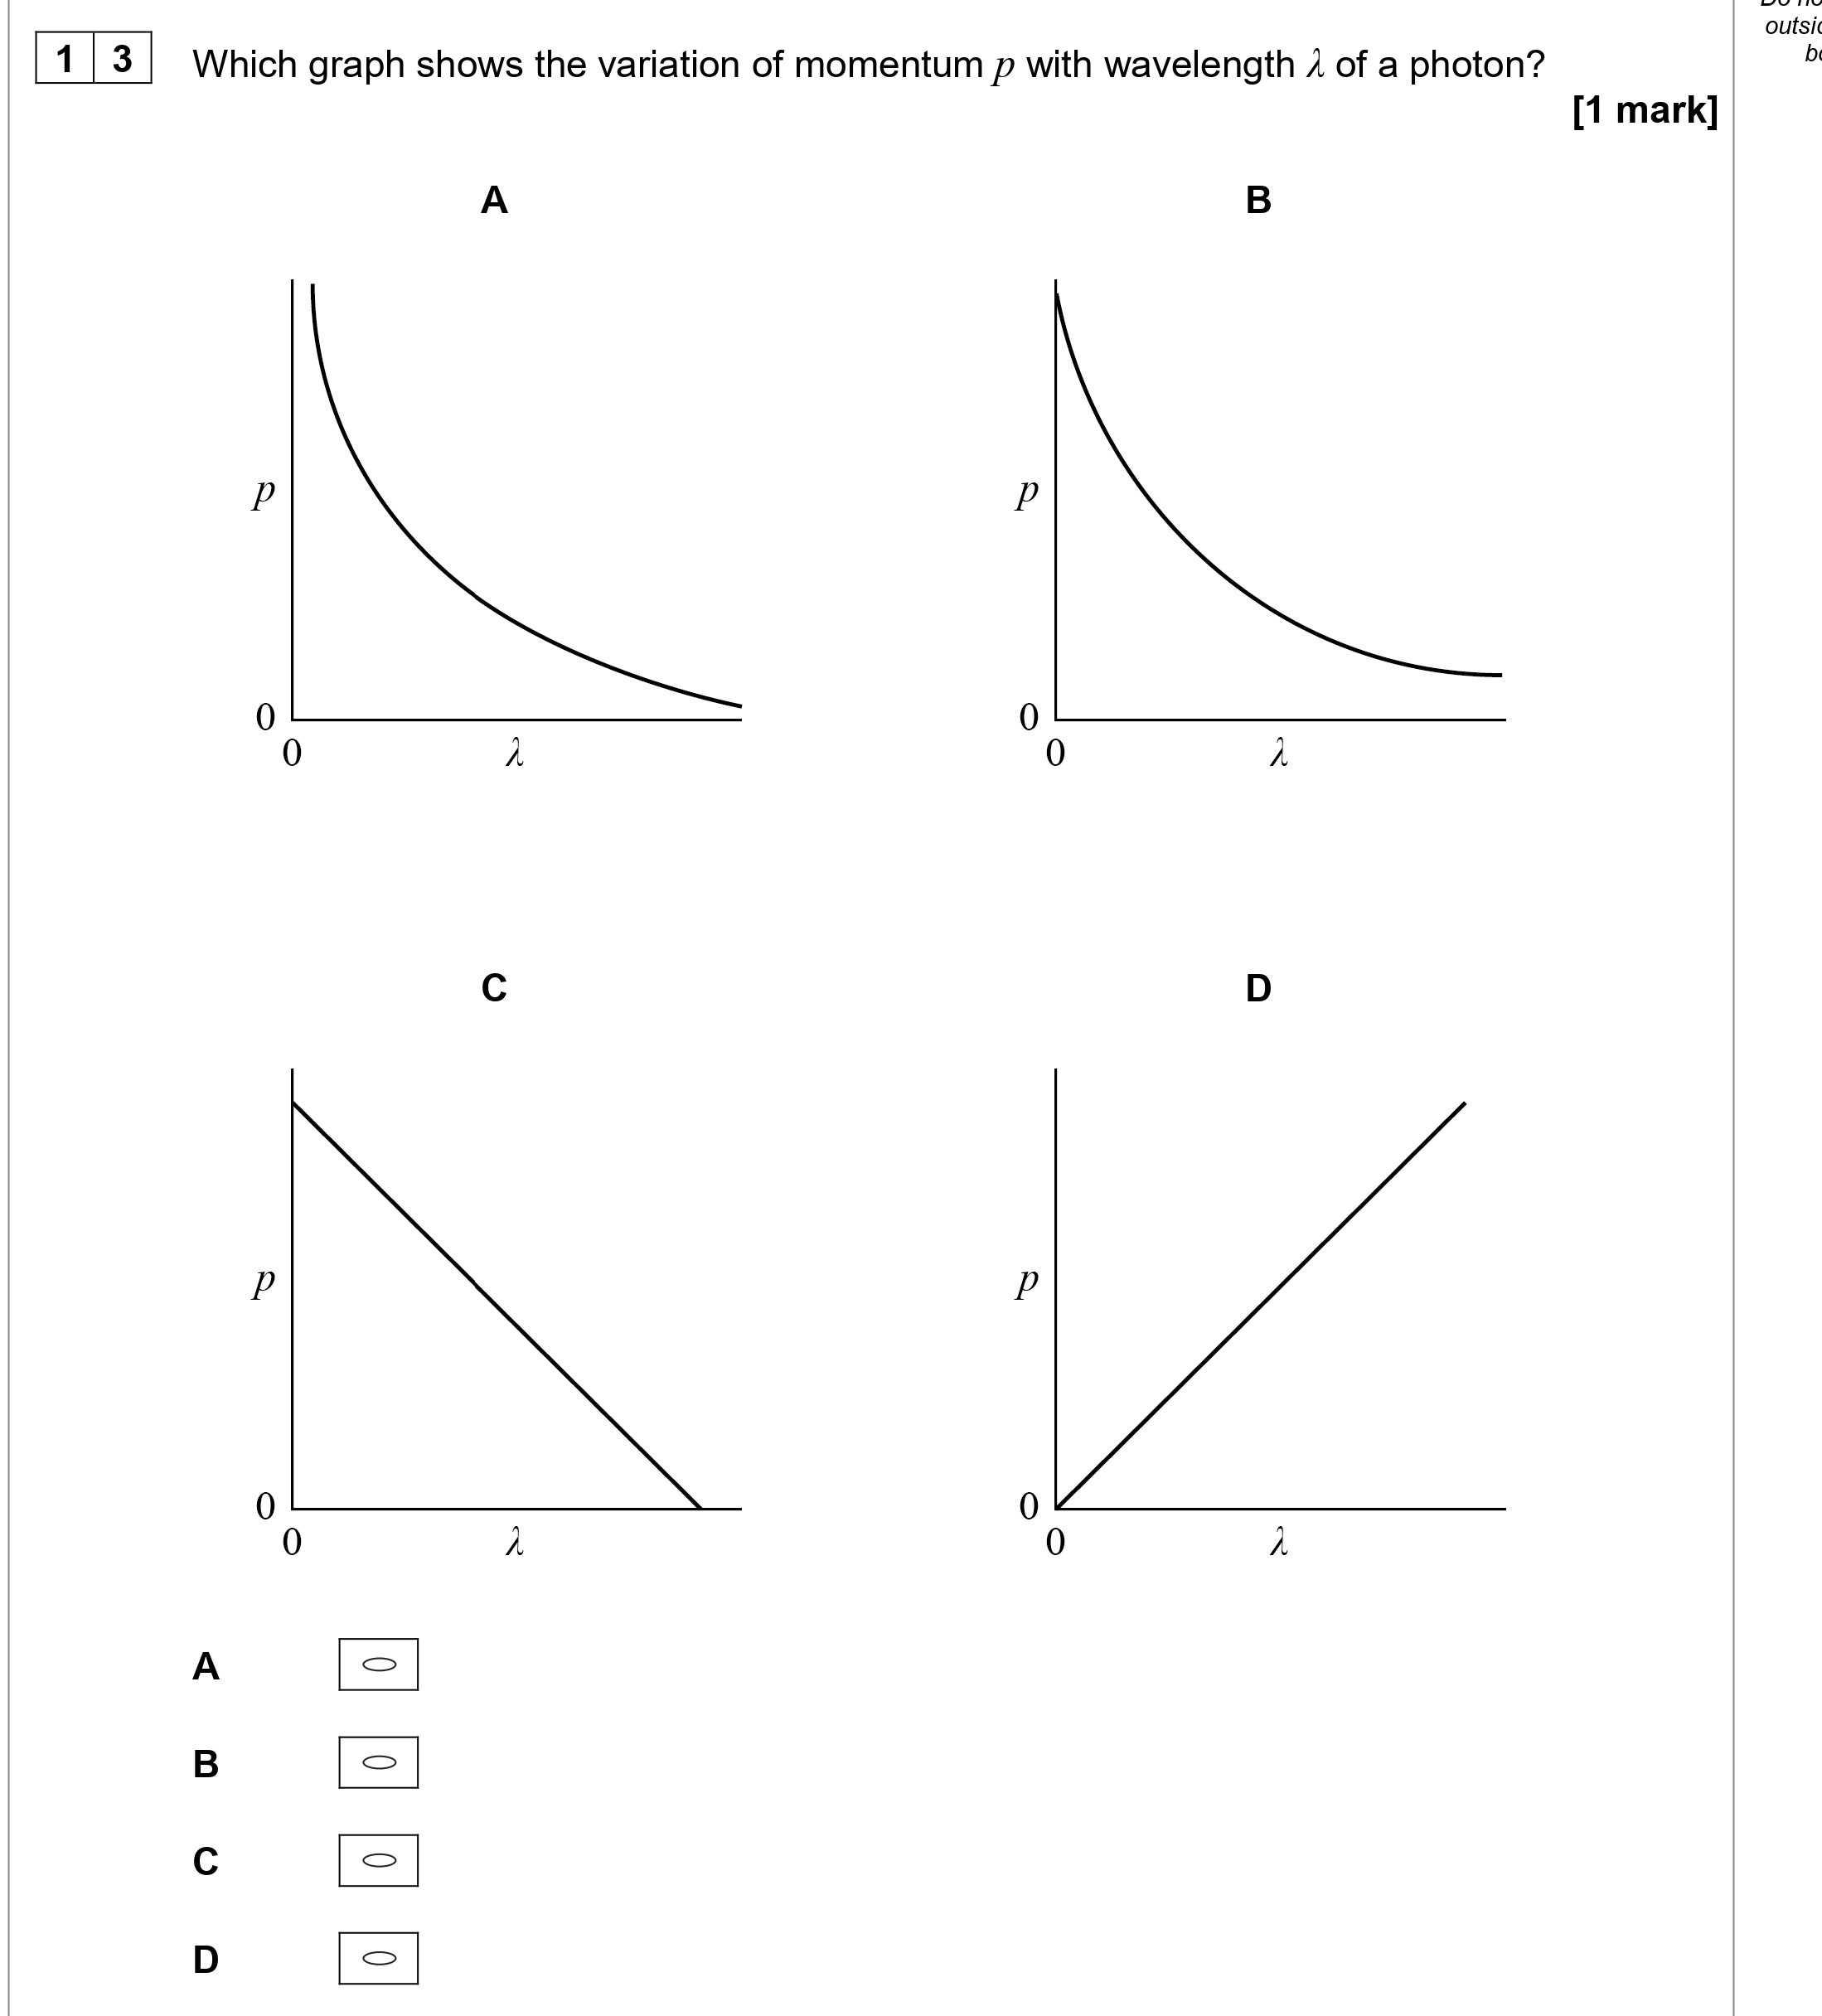
Which graph shows the variation of momentum $p$ with wavelength $\lambda$ of a photon?
A
B
C
D - AQA - A-Level Physics - Question 13 - 2020 - Paper 1
Question 13
Which graph shows the variation of momentum $p$ with wavelength $\lambda$ of a photon?
A
B
C
D
Worked Solution & Example Answer:Which graph shows the variation of momentum $p$ with wavelength $\lambda$ of a photon?
A
B
C
D - AQA - A-Level Physics - Question 13 - 2020 - Paper 1
Step 1
Identify the relationship between momentum and wavelength
96%
114 rated
Only available for registered users.
Sign up now to view full answer, or log in if you already have an account!
Answer
The momentum p of a photon is inversely proportional to its wavelength λ. This relationship is given by the formula:
p=λh
where h is Planck's constant. From this equation, as the wavelength increases, the momentum decreases.
Step 2
Analyze the graph options
99%
104 rated
Only available for registered users.
Sign up now to view full answer, or log in if you already have an account!
Answer
Given the inverse relationship, the correct graph should show a curve that decreases as λ increases. This indicates that for larger wavelengths, the momentum is lower.
Step 3
Select the correct graph
96%
101 rated
Only available for registered users.
Sign up now to view full answer, or log in if you already have an account!
Answer
Based on the analysis, the correct answer is option C, which shows a decreasing trend as λ increases, consistent with the relation p=λh.