Photo AI
Louise is interested to see whether there is a difference between the number of pictures recalled by children with dyslexia and by those who do not have dyslexia - AQA - A-Level Psychology - Question 5 - 2017 - Paper 1
Question 5
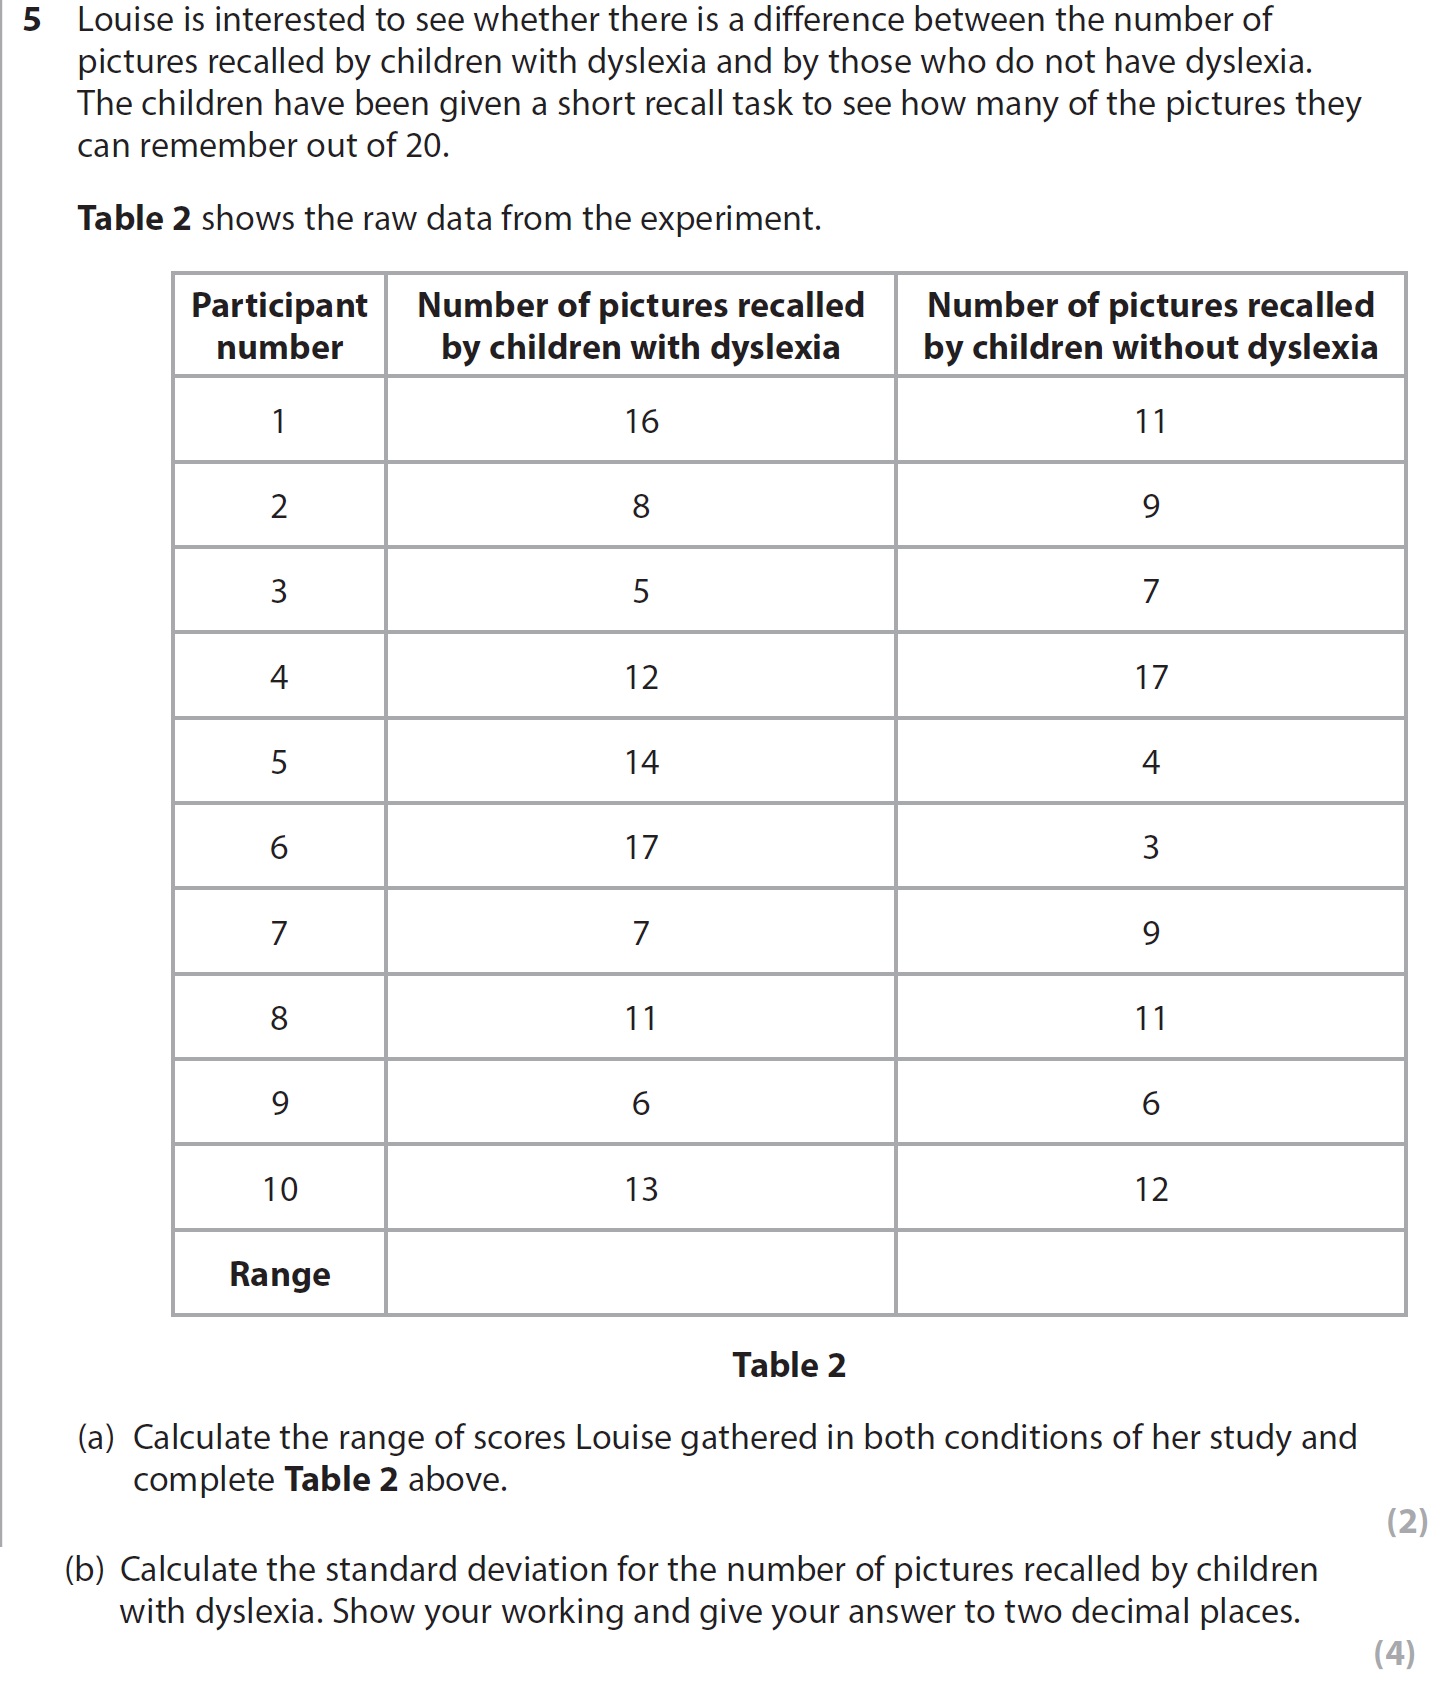
Louise is interested to see whether there is a difference between the number of pictures recalled by children with dyslexia and by those who do not have dyslexia. Th... show full transcript
Worked Solution & Example Answer:Louise is interested to see whether there is a difference between the number of pictures recalled by children with dyslexia and by those who do not have dyslexia - AQA - A-Level Psychology - Question 5 - 2017 - Paper 1
Step 1
Calculate the range of scores for children with dyslexia

Answer
To find the range of scores for children with dyslexia, we first identify the maximum and minimum values from the recalled pictures. The maximum score is 17 (from Participant 6), and the minimum score is 5 (from Participant 3). Therefore, the range is calculated as follows:
Thus, the range for children with dyslexia is 12.
Step 2
Step 3
Calculate the standard deviation for the number of pictures recalled by children with dyslexia
Answer
To calculate the standard deviation, we first need to find the mean of the scores:
Where:
- are the scores
- is the number of participants
The scores for children with dyslexia are: 16, 8, 5, 12, 14, 17, 11, 11, 7, 13.
-
Calculate mean:
- Sum of scores: 16 + 8 + 5 + 12 + 14 + 17 + 11 + 11 + 7 + 13 = 14 + 17 + 12 + 16 + 11 + 11 + 7 + 5 + 8 = 14 + 17 + 12 + 54 = 97
- Number of scores, n = 10
-
Calculate variance:
- First, find the squared differences from the mean:
- Calculate standard deviation:
- The standard deviation is calculated as:
- After performing the calculations, the standard deviation is approximately 3.52.
Final Answer: The standard deviation for the number of pictures recalled by children with dyslexia is 3.52.