Using the data in Extract F, explain one implication of the level of capacity utilisation for the soft drinks manufacturer A, compared to B - Edexcel - A-Level Business - Question 2 - 2017 - Paper 2
Question 2
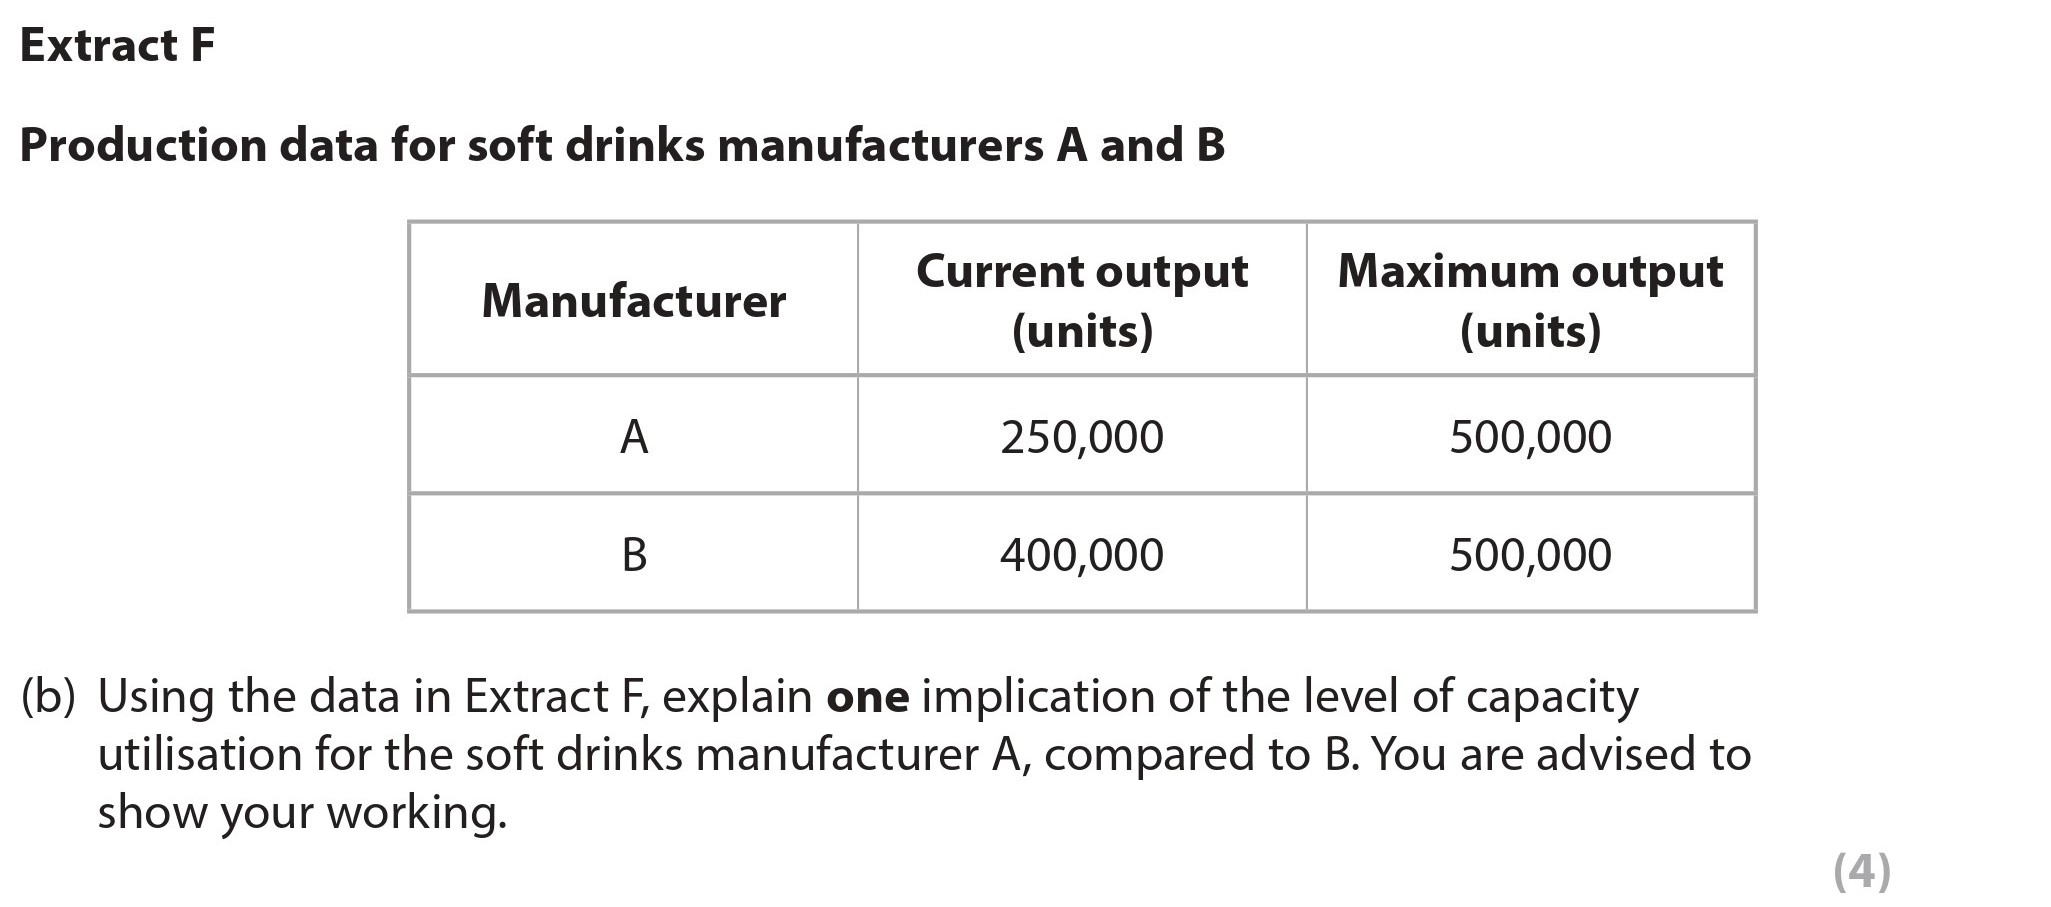
Using the data in Extract F, explain one implication of the level of capacity utilisation for the soft drinks manufacturer A, compared to B. You are advised to show ... show full transcript
Worked Solution & Example Answer:Using the data in Extract F, explain one implication of the level of capacity utilisation for the soft drinks manufacturer A, compared to B - Edexcel - A-Level Business - Question 2 - 2017 - Paper 2
Step 1
Calculate capacity utilisation for Manufacturer A
96%
114 rated
Only available for registered users.
Sign up now to view full answer, or log in if you already have an account!
Answer
To calculate the capacity utilisation for Manufacturer A, use the formula:
Capacity Utilisation for A=(500,000250,000)×100=50%
Step 2
Calculate capacity utilisation for Manufacturer B
99%
104 rated
Only available for registered users.
Sign up now to view full answer, or log in if you already have an account!
Answer
Similarly, for Manufacturer B, the capacity utilisation is:
Capacity Utilisation for B=(500,000400,000)×100=80%
Step 3
Explain one implication of the capacity utilisation levels
96%
101 rated
Only available for registered users.
Sign up now to view full answer, or log in if you already have an account!
Answer
The analysis indicates that Manufacturer A has a capacity utilisation of 50%, whereas Manufacturer B operates at 80% capacity. This lower capacity utilisation for Manufacturer A implies that fixed costs are distributed over a smaller number of units produced, potentially resulting in higher average costs per unit. Therefore, Manufacturer A may face challenges in competitiveness, as higher costs could restrict its ability to price products effectively compared to Manufacturer B.