Photo AI
Cobalt is a key metal used in the batteries of electric cars - Edexcel - A-Level Economics A - Question 2 - 2021 - Paper 1
Question 2
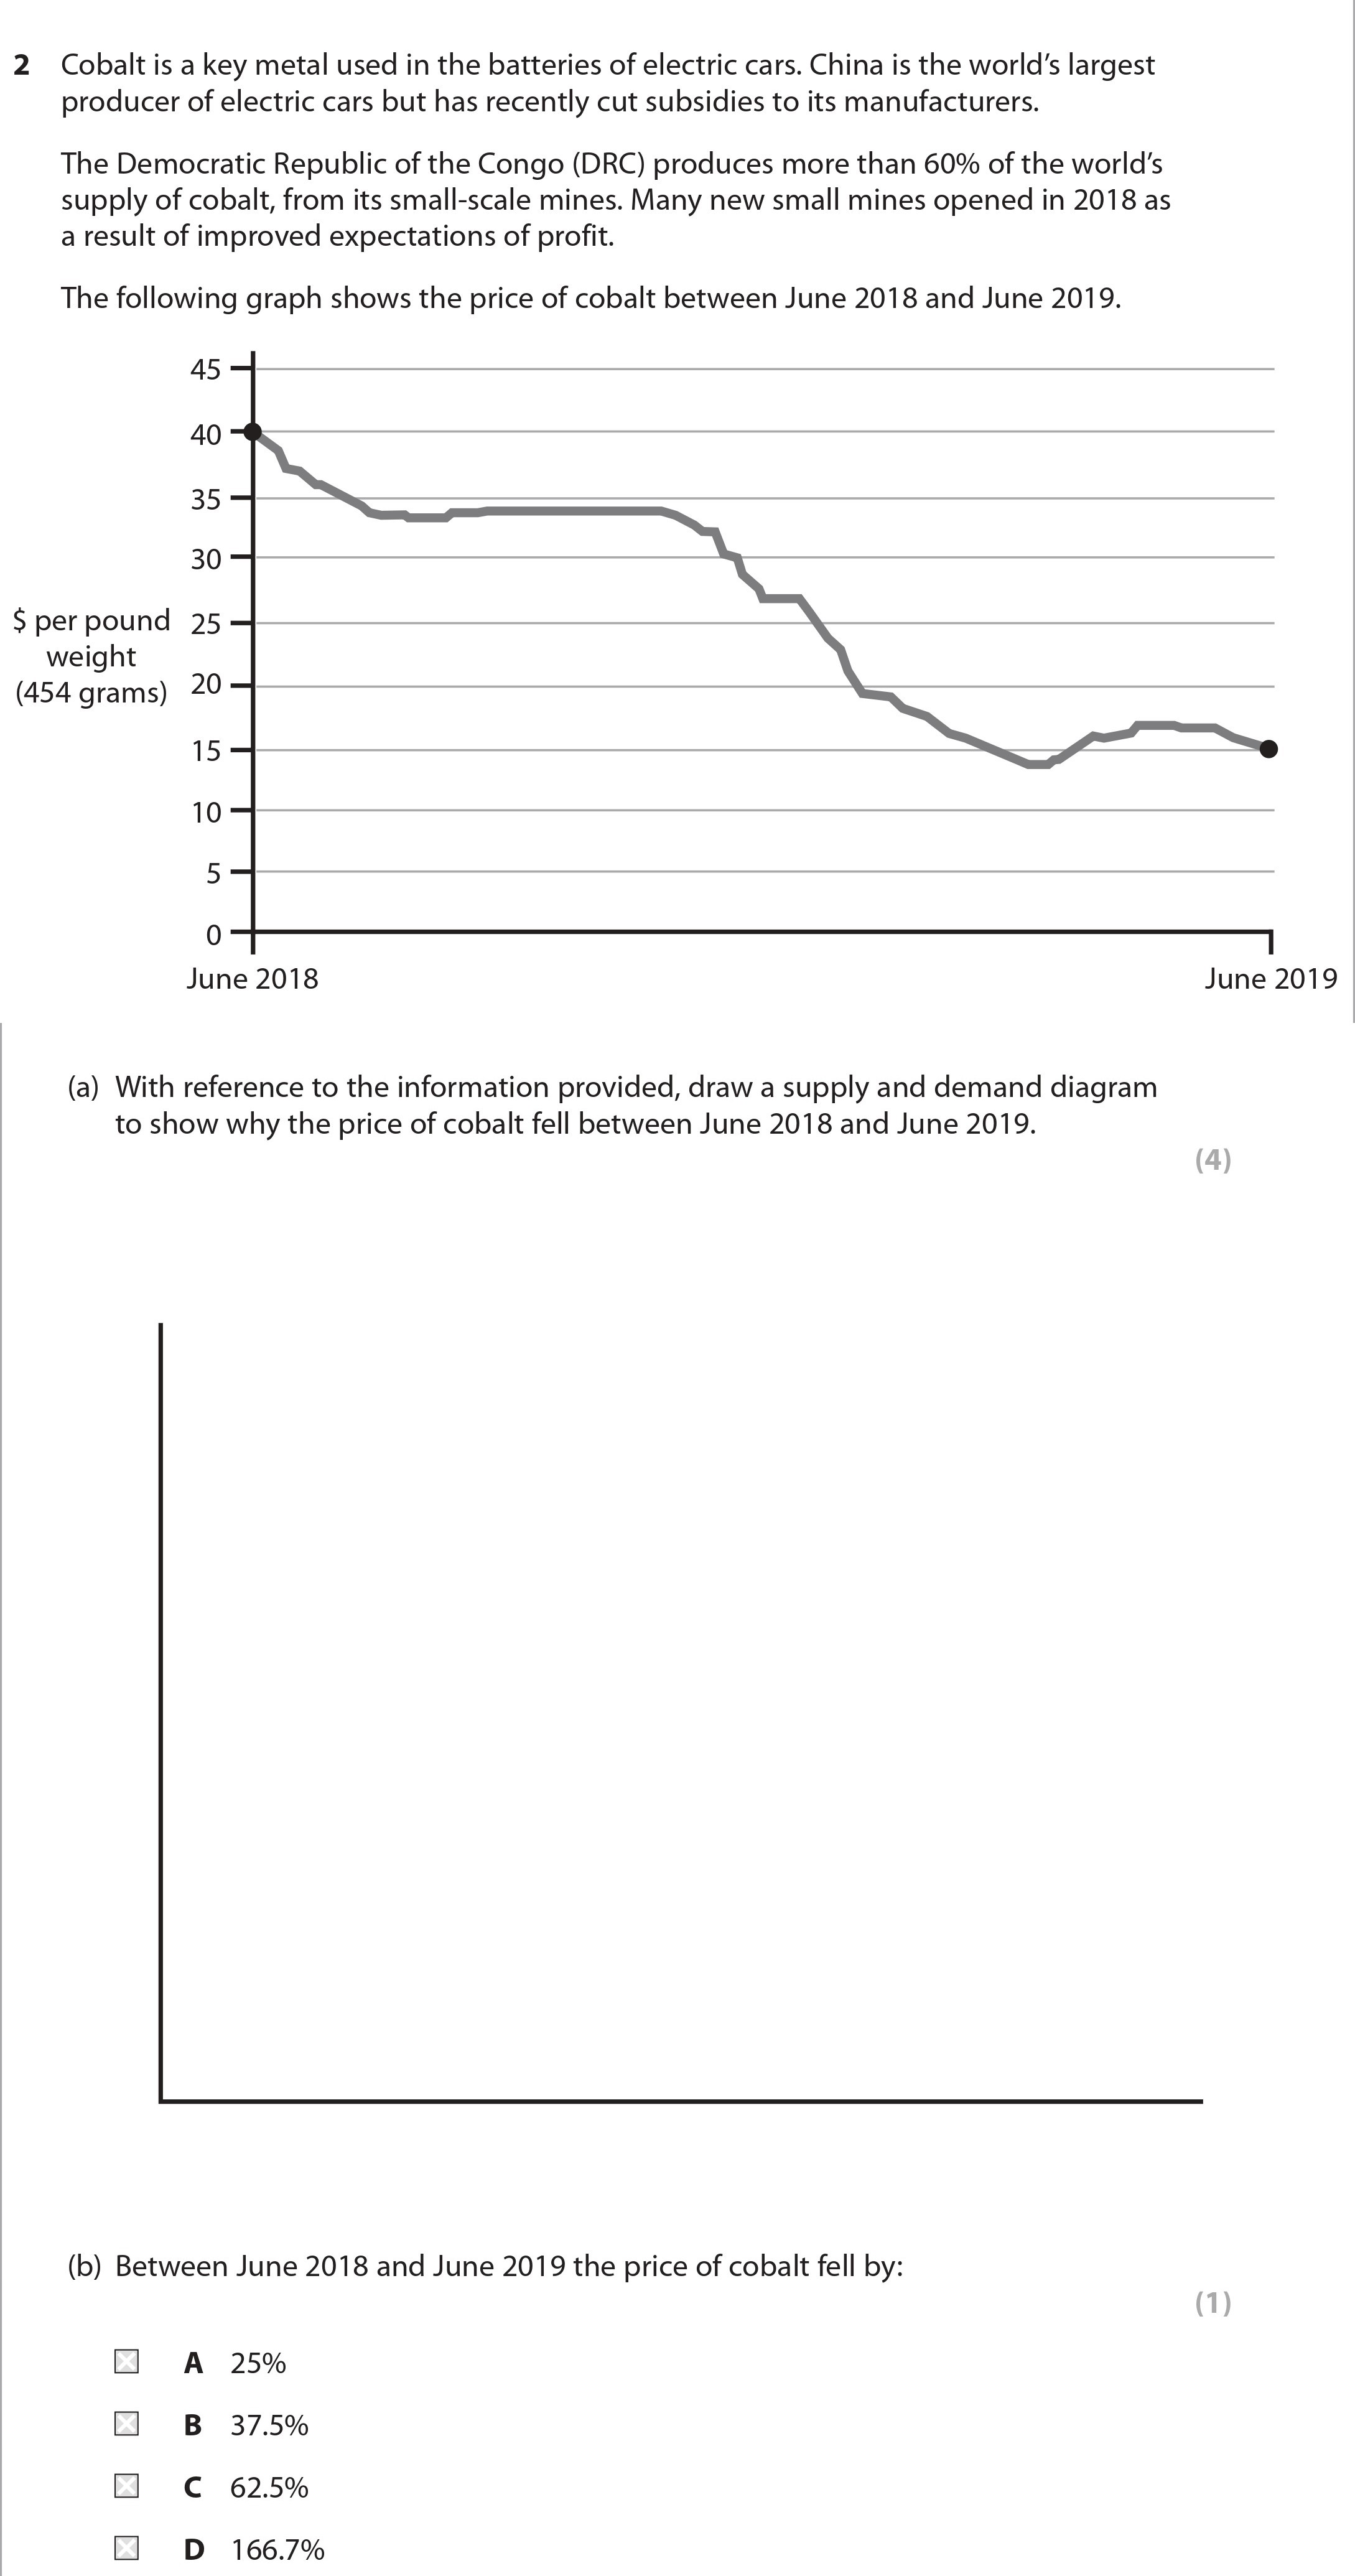
Cobalt is a key metal used in the batteries of electric cars. China is the world’s largest producer of electric cars but has recently cut subsidies to its manufactur... show full transcript
Worked Solution & Example Answer:Cobalt is a key metal used in the batteries of electric cars - Edexcel - A-Level Economics A - Question 2 - 2021 - Paper 1
Step 1
Draw a supply and demand diagram showing the reasons for the price fall

Answer
To illustrate why the price of cobalt fell between June 2018 and June 2019, begin by drawing a standard supply and demand diagram. The steps are as follows:
-
Draw the Axes: Label the vertical axis as ‘Price ($ per weight in grams)’ and the horizontal axis as ‘Quantity’.
-
Initial Curves: Plot the initial supply curve (S) and demand curve (D).
-
Shift the Supply Curve: With the opening of new small mines, supply increased. Shift the supply curve to the right, labeling the new curve S1.
-
Shift the Demand Curve: The decrease in subsidies may have caused demand to decrease. Shift the demand curve to the left, labeling the new curve D1.
-
New Equilibrium: Mark the new equilibrium point (E1) where S1 and D1 intersect, indicating a lower price than the initial equilibrium price (E).
This diagram clearly shows how the increased supply and reduced demand contributed to the fall in cobalt prices.
Step 2
Between June 2018 and June 2019 the price of cobalt fell by:
Answer
To determine the correct answer for the percentage decrease in cobalt prices:
- Calculate the initial and final prices from the graph.
- Taking an example where the price dropped from approximately 15, the calculation would be:
ext{Percentage Change} = rac{ ext{Final Price} - ext{Initial Price}}{ ext{Initial Price}} imes 100
For our numbers:
ext{Percentage Change} = rac{15 - 40}{40} imes 100 = rac{-25}{40} imes 100 = -62.5 ext{%}
Thus, the price of cobalt fell by 62.5%, which corresponds to option C.