Photo AI
Cobalt is a key metal used in the batteries of electric cars - Edexcel - A-Level Economics A - Question 2 - 2021 - Paper 1
Question 2
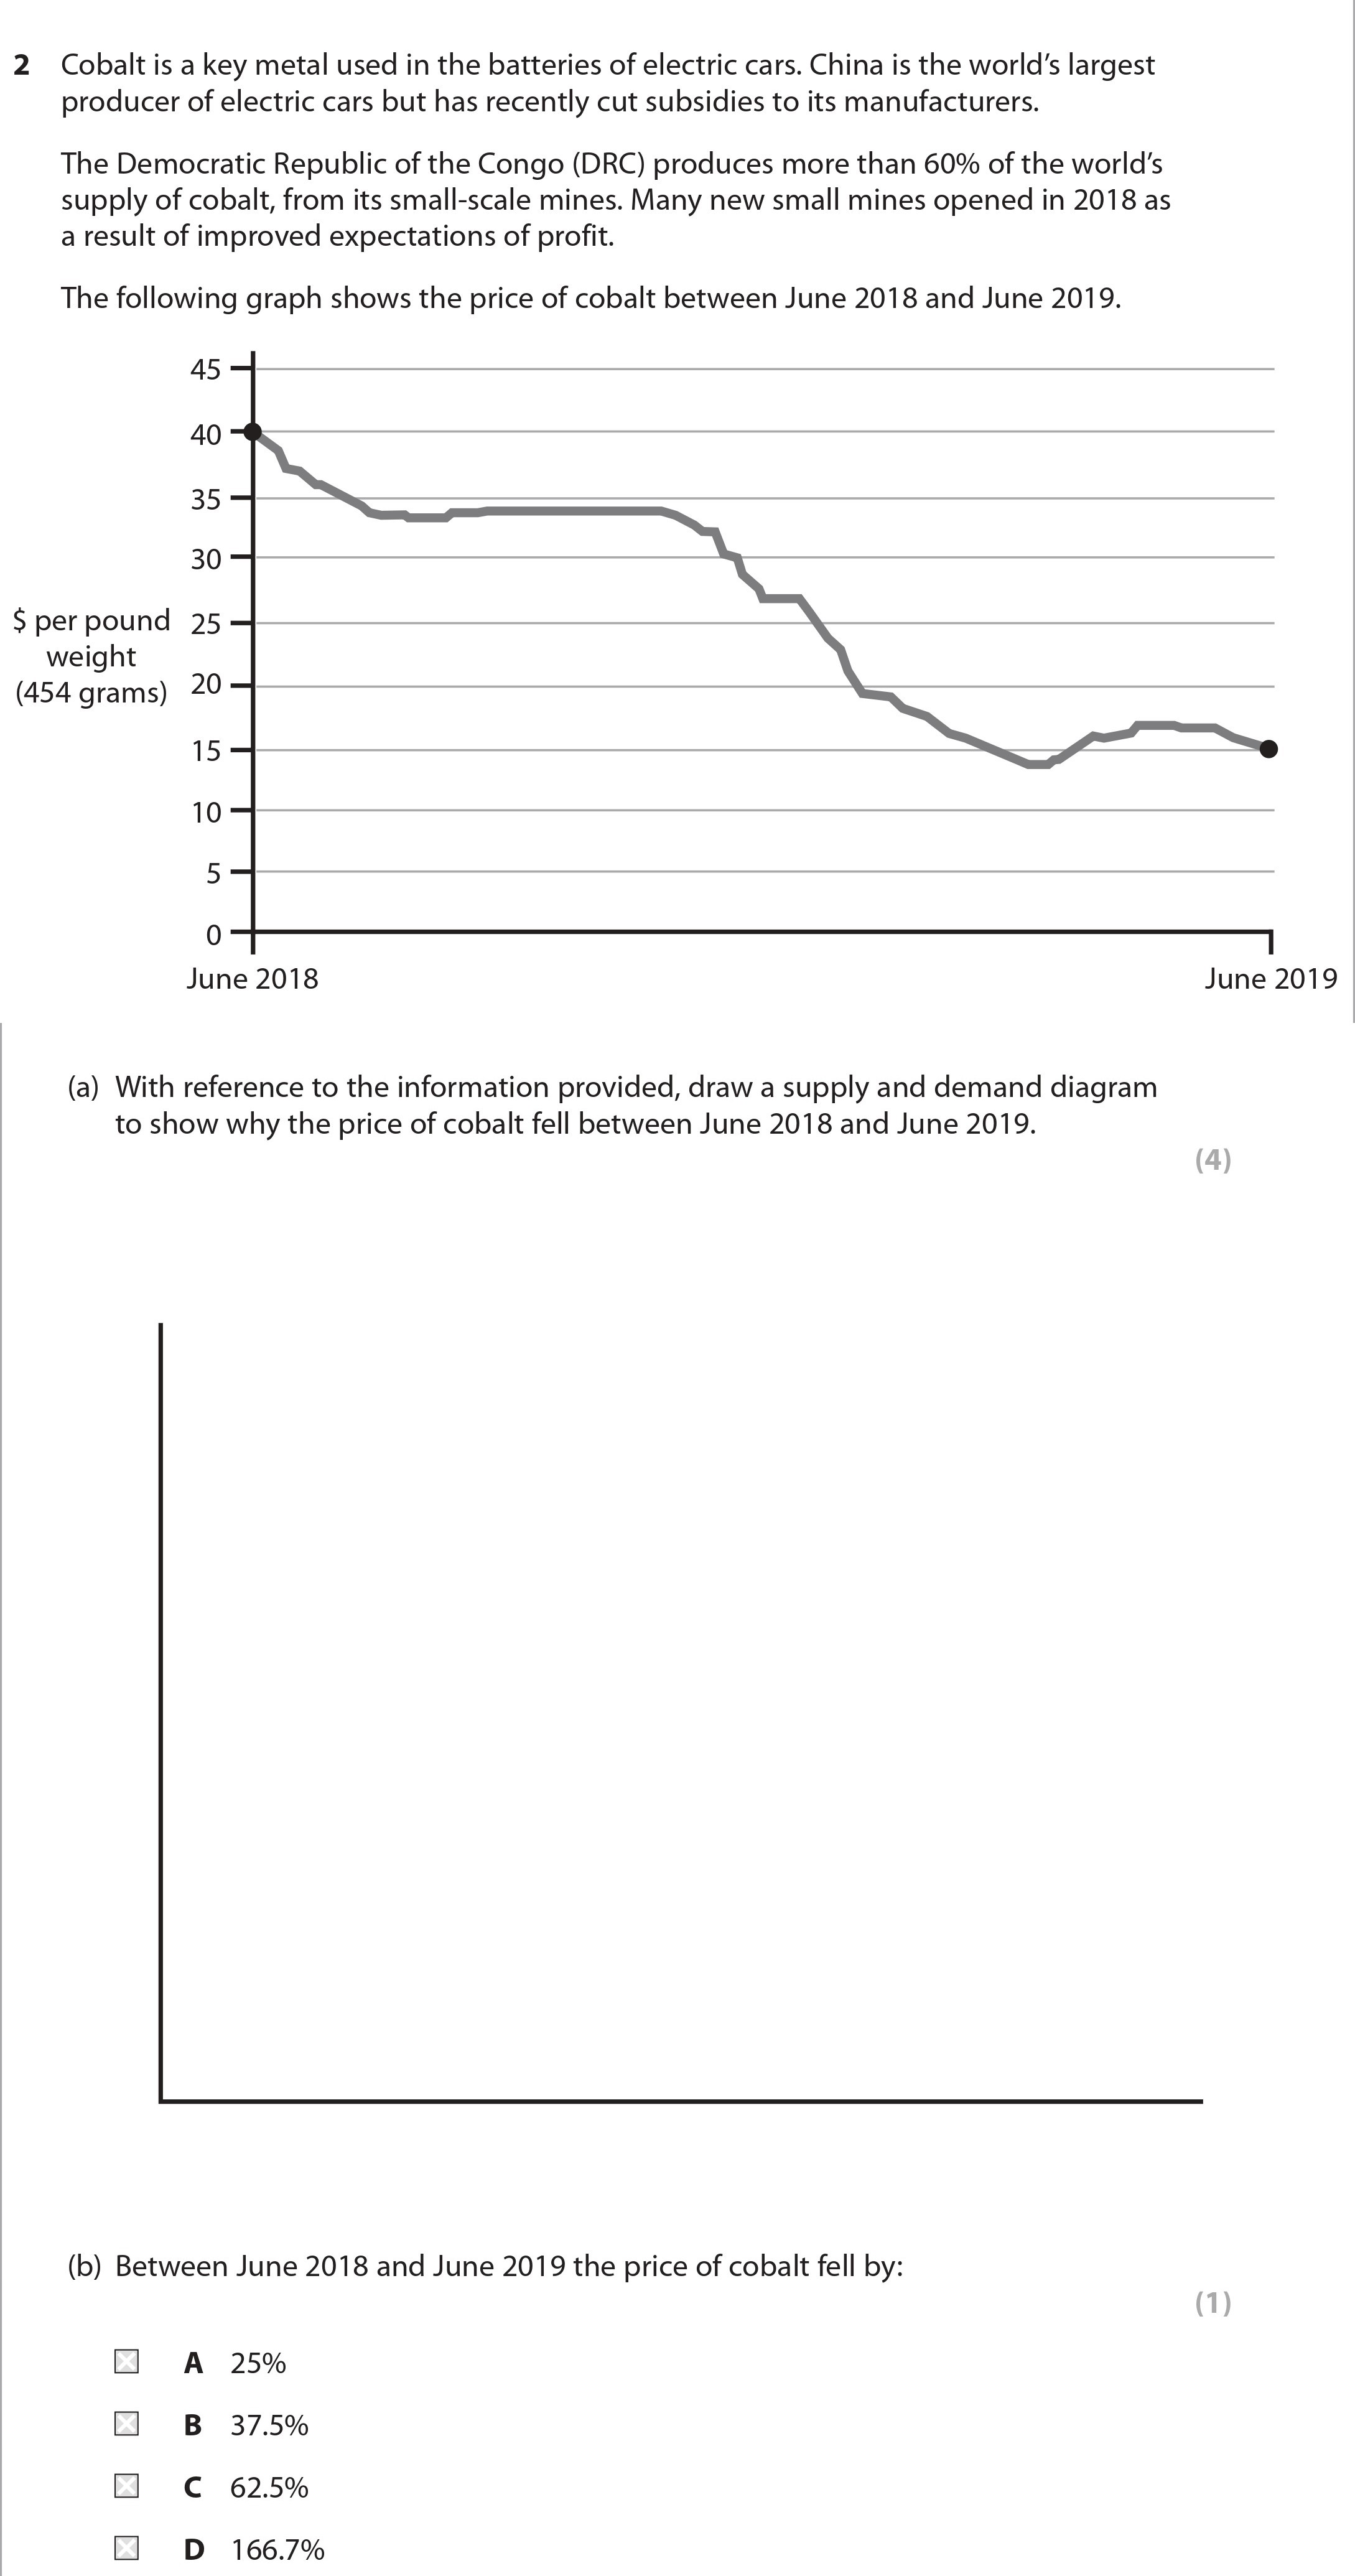
Cobalt is a key metal used in the batteries of electric cars. China is the world’s largest producer of electric cars but has recently cut subsidies to its manufactur... show full transcript
Worked Solution & Example Answer:Cobalt is a key metal used in the batteries of electric cars - Edexcel - A-Level Economics A - Question 2 - 2021 - Paper 1
Step 1
Supply and demand diagram with a right shift in the supply curve and a left shift in the demand curve

Answer
To illustrate the changes in the market for cobalt, we first need to draw a supply and demand diagram. Locate the initial equilibrium price (P) and quantity (Q) at the intersection of the supply (S) and demand (D) curves.
-
Right Shift in Supply Curve: As more small mines opened in 2018, the supply of cobalt increased, leading to a rightward shift in the supply curve from S to S1. This shift indicates that at every price level, more cobalt is available in the market.
-
Left Shift in Demand Curve: Following China's subsidy cuts and fluctuating market expectations, there was a decrease in demand for cobalt, shifting the demand curve left from D to D1. This shift shows that at every price, less cobalt is demanded.
-
New Equilibrium: The new equilibrium is where S1 intersects D1, resulting in a lower price (P1) and larger quantity (Q1) sold in the market. This decreases the price of cobalt from P to P1, highlighting how increases in supply and decreases in demand contributed to the fall in price from June 2018 to June 2019.
Step 2
Between June 2018 and June 2019 the price of cobalt fell by:
Answer
To calculate the percentage decrease in price, we look at the values provided in the graph. If the price of cobalt fell from approximately 10 (in June 2019), we can calculate the percentage decline as follows:
exchange change = original price - new price = $40 - $10 = $30

exchange rate = (price change / original price) * 100 = ($30 / $40) * 100 = 75%
This means that the price of cobalt fell by 75%. However, the closest answer choice in the options provided is C: 62.5%, which needs to be confirmed with accurate values from the graph.