Photo AI
Cobalt is a key metal used in the batteries of electric cars - Edexcel - A-Level Economics A - Question 2 - 2021 - Paper 1
Question 2
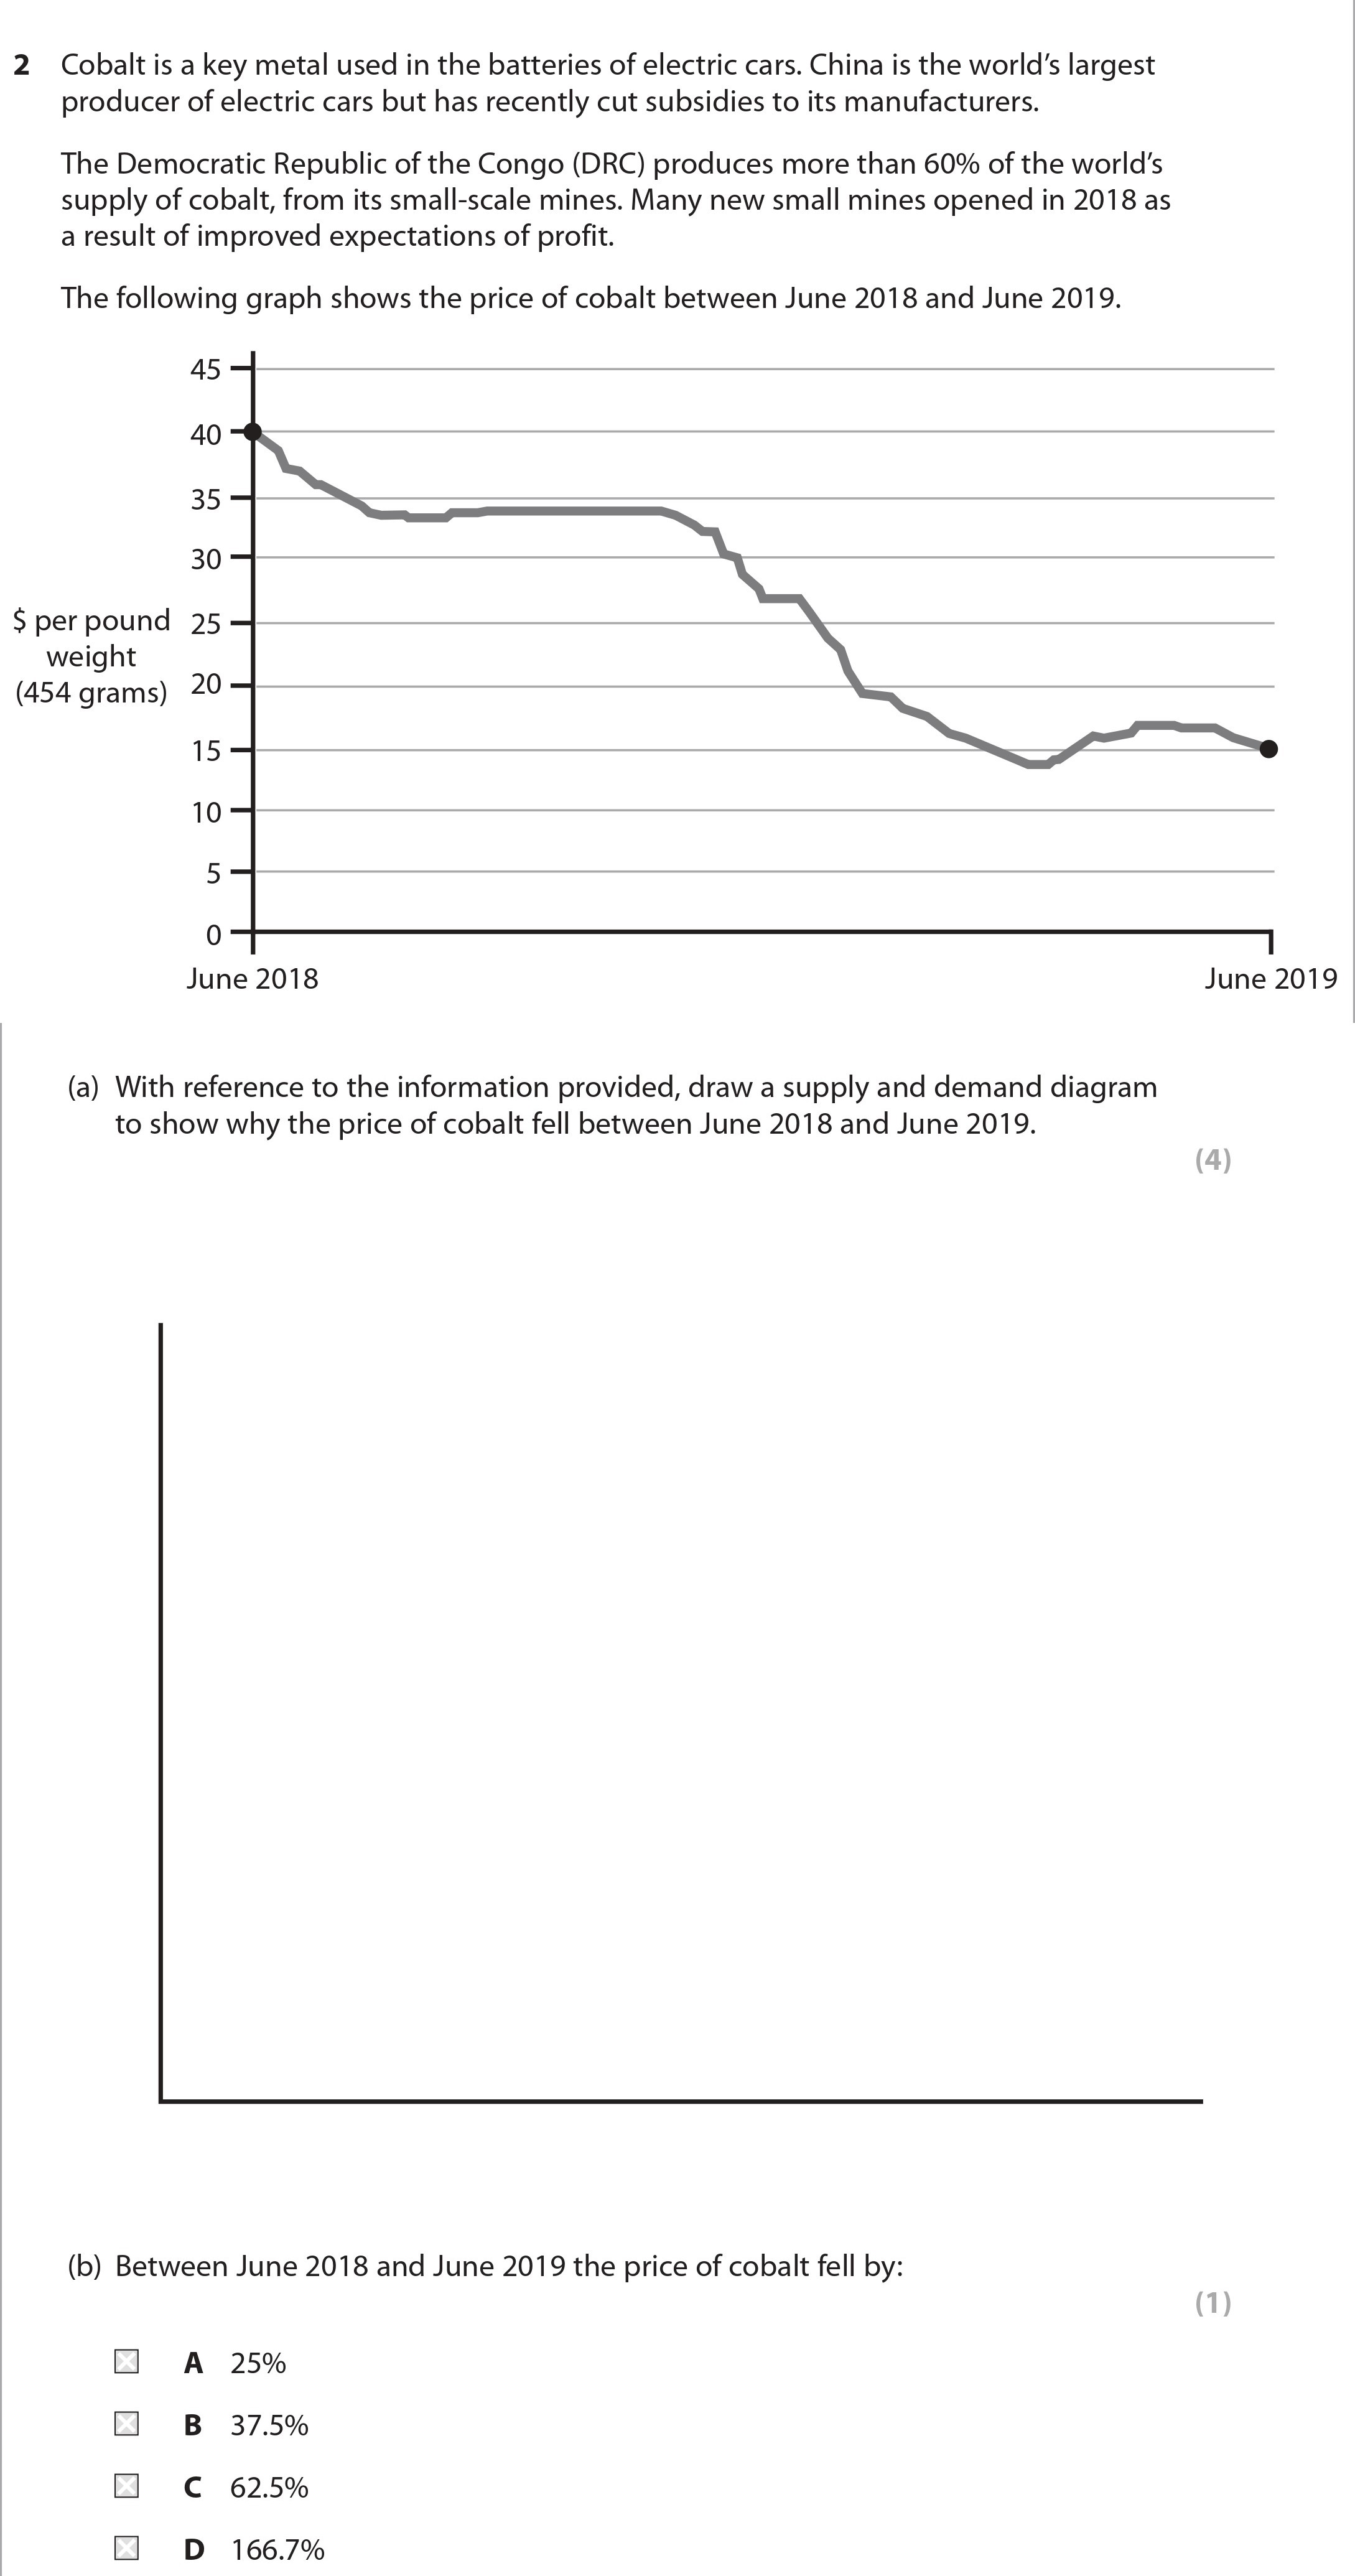
Cobalt is a key metal used in the batteries of electric cars. China is the world’s largest producer of electric cars but has recently cut subsidies to its manufactur... show full transcript
Worked Solution & Example Answer:Cobalt is a key metal used in the batteries of electric cars - Edexcel - A-Level Economics A - Question 2 - 2021 - Paper 1
Step 1
Supply and demand diagram to show why the price of cobalt fell between June 2018 and June 2019.

Answer
To illustrate the changes in the cobalt market, a supply and demand diagram must be drawn.
-
Supply Curve Shift: The supply curve (S) shifts to the right (S1) due to the opening of new small mines in the DRC. This increase in supply puts downward pressure on the price of cobalt.
-
Demand Curve Shift: The demand curve (D) shifts to the left (D1), possibly due to reduced subsidies affecting demand from China, which also contributes to the decrease in price.
-
New Equilibrium: The intersection of S1 and D1 establishes a new equilibrium price (E1), which is lower than the previous equilibrium price (E) before June 2018. The graph should indicate the new lower price (P1) and the initial price (P).
Step 2
Between June 2018 and June 2019 the price of cobalt fell by:
Answer
The fall in price can be calculated by examining the price from June 2018 to June 2019. Assuming the price dropped from a higher value (for example, 40) to a lower value (for example, 15), the calculation is as follows:
- Initial Price: $40
- Final Price: $15
- Price Decrease: 15 = $25
- Percentage Fall: \[ rac{25}{40} imes 100 = 62.5% ]
Hence, the correct answer is C. The price of cobalt fell by 62.5%.