Photo AI
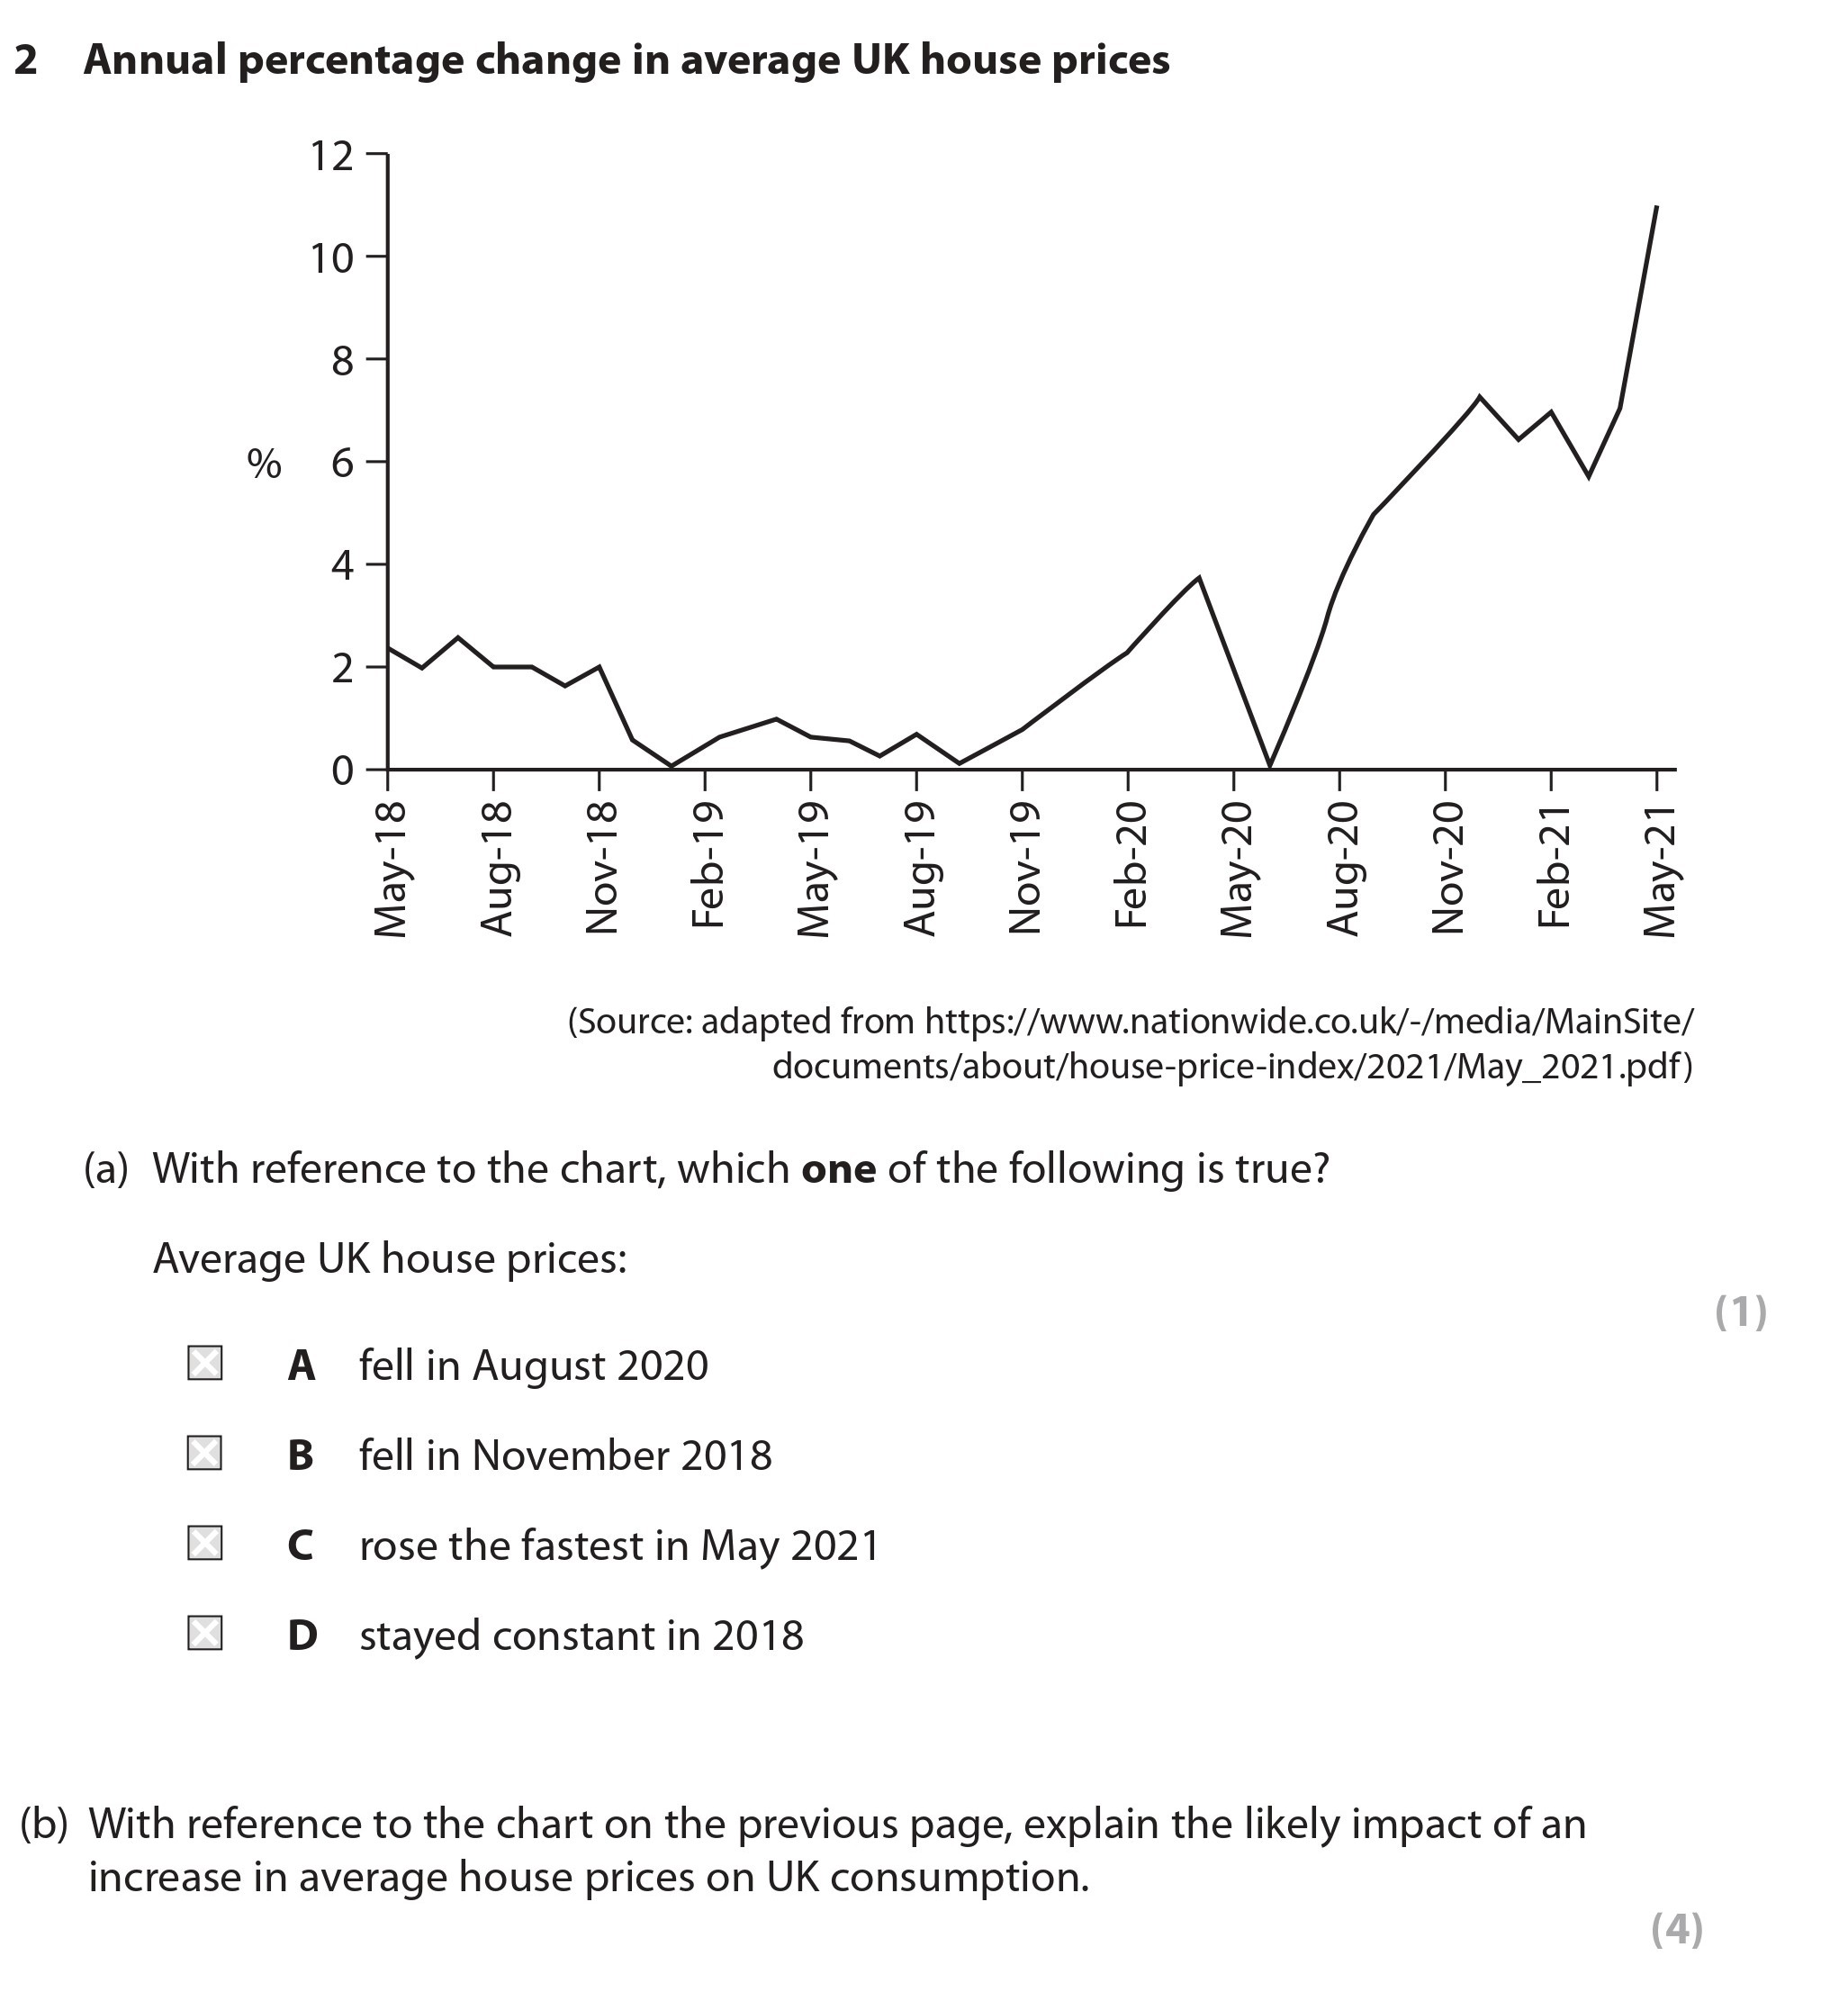
Annual percentage change in average UK house prices (Source: adapted from https://www.nationwide.co.uk/-/media/MainSite/documents/about/house-price-index/2021/May.pdf) (a) With reference to the chart, which one of the following is true? Average UK house prices: A fell in August 2020 B fell in November 2018 C rose the fastest in May 2021 D stayed constant in 2018 (b) With reference to the chart on the previous page, explain the likely impact of an increase in average house prices on UK consumption. - Edexcel - A-Level Economics A - Question 2 - 2022 - Paper 2
Question 2
Annual percentage change in average UK house prices (Source: adapted from https://www.nationwide.co.uk/-/media/MainSite/documents/about/house-price-index/2021/May.p... show full transcript
Worked Solution & Example Answer:Annual percentage change in average UK house prices (Source: adapted from https://www.nationwide.co.uk/-/media/MainSite/documents/about/house-price-index/2021/May.pdf) (a) With reference to the chart, which one of the following is true? Average UK house prices: A fell in August 2020 B fell in November 2018 C rose the fastest in May 2021 D stayed constant in 2018 (b) With reference to the chart on the previous page, explain the likely impact of an increase in average house prices on UK consumption. - Edexcel - A-Level Economics A - Question 2 - 2022 - Paper 2
Step 1
a) With reference to the chart, which one of the following is true?

Answer
To determine which statement is true, we will analyze the chart:
- A fell in August 2020: This statement is incorrect because the chart shows that house prices rose in August 2020.
- B fell in November 2018: This statement is also incorrect; house prices did not fall in November 2018, but rather showed an upward trend.
- C rose the fastest in May 2021: This statement is correct. The chart indicates a significant increase in house prices in May 2021 compared to previous months.
- D stayed constant in 2018: This statement is incorrect as the prices displayed in the chart fluctuated throughout 2018.
Thus, the only correct answer is C.
Step 2
b) With reference to the chart on the previous page, explain the likely impact of an increase in average house prices on UK consumption.
Answer
An increase in average house prices can have several impacts on UK consumption, which can be analyzed as follows:
Wealth Effect
- As house prices rise, homeowners feel wealthier. This may lead to increased consumption as they have higher confidence in their financial situation.
Consumer Spending
- Higher house prices can lead to increased consumer spending, as wealthier homeowners are more likely to purchase goods and services.
- Additionally, homeowners may withdraw equity from their properties, further boosting their spending power.
Mortgage Equity Withdrawal
- With rising values, homeowners might opt for mortgage equity withdrawal, enabling them to access cash for personal expenditure.
Effect on Saving
- As confidence increases, consumers may be less inclined to save, preferring instead to invest in consumption, which can stimulate the economy.
In conclusion, the impact of rising house prices likely promotes a positive cycle of increased consumption and economic activity.