Photo AI
Figure 1 shows the speed-time graph of a cyclist moving on a straight road over a 7 s period - Edexcel - A-Level Maths Mechanics - Question 1 - 2006 - Paper 1
Question 1
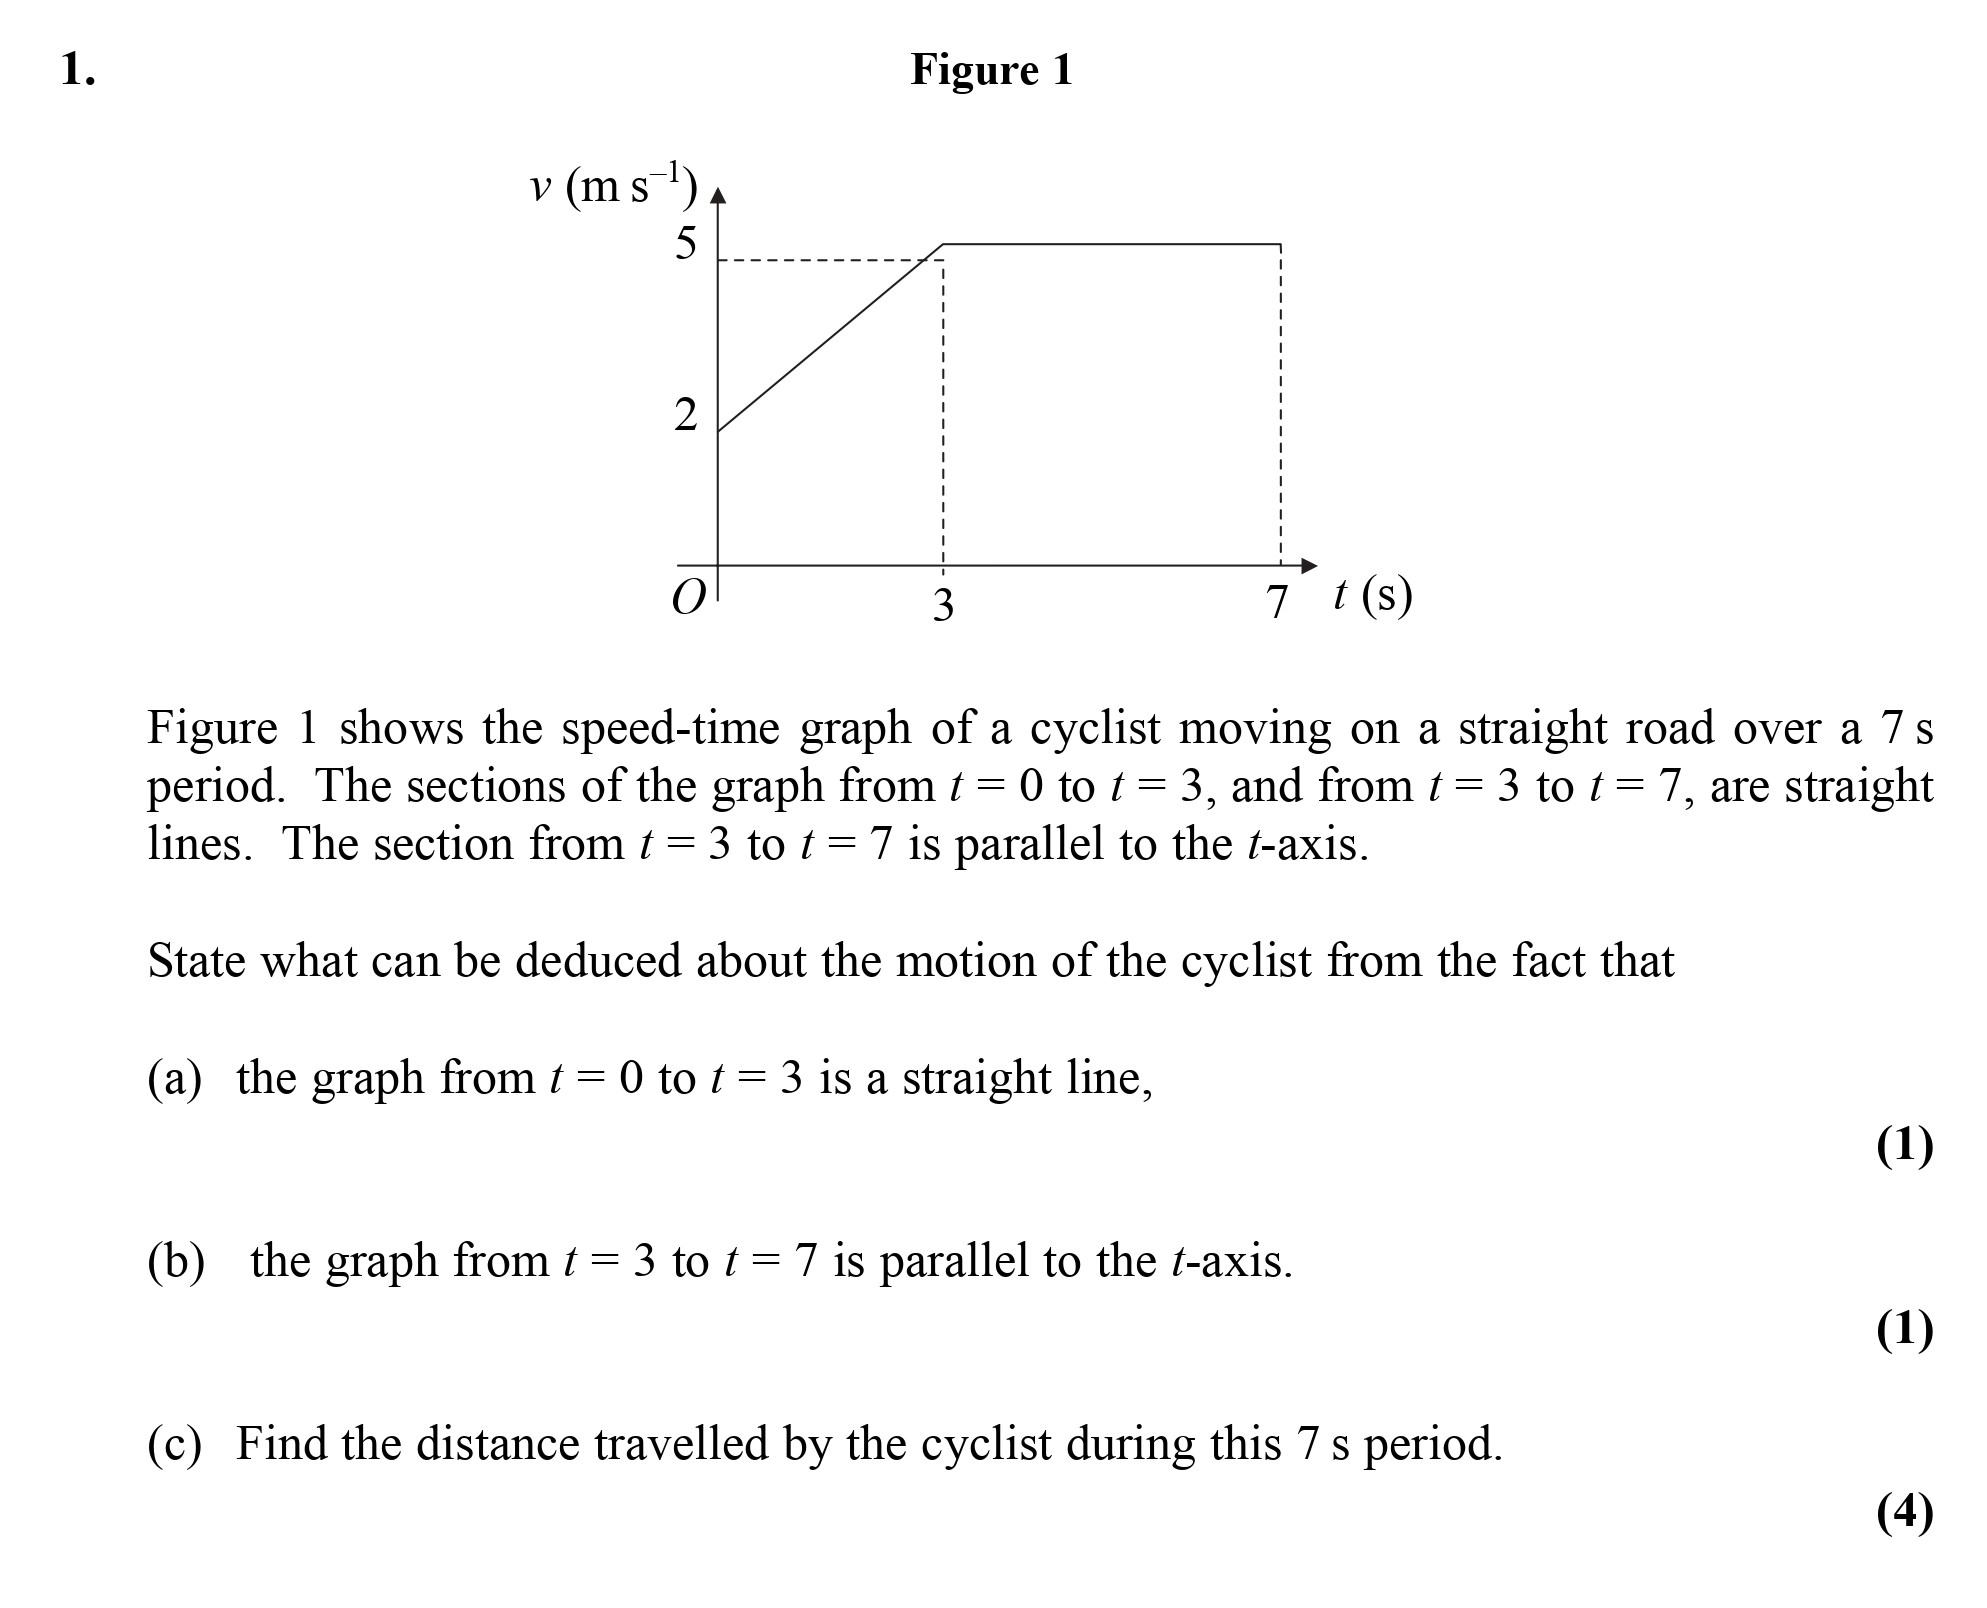
Figure 1 shows the speed-time graph of a cyclist moving on a straight road over a 7 s period. The sections of the graph from t = 0 to t = 3, and from t = 3 to t = 7,... show full transcript
Worked Solution & Example Answer:Figure 1 shows the speed-time graph of a cyclist moving on a straight road over a 7 s period - Edexcel - A-Level Maths Mechanics - Question 1 - 2006 - Paper 1
Step 1

Step 2
Step 3
c) Find the distance travelled by the cyclist during this 7 s period.
Answer
To calculate the distance travelled, we can analyze the graph. The area under the speed-time graph represents the distance. From t = 0 to t = 3, the distance can be calculated using the area of a triangle:
From t = 3 to t = 7, the distance can be calculated using the area of a rectangle:
Now, adding both areas together gives us the total distance:
Thus, the total distance travelled by the cyclist during the 7 s period is 27.5 m.