Photo AI
Charlie is studying the time it takes members of his company to travel to the office - Edexcel - A-Level Maths Mechanics - Question 4 - 2018 - Paper 2
Question 4
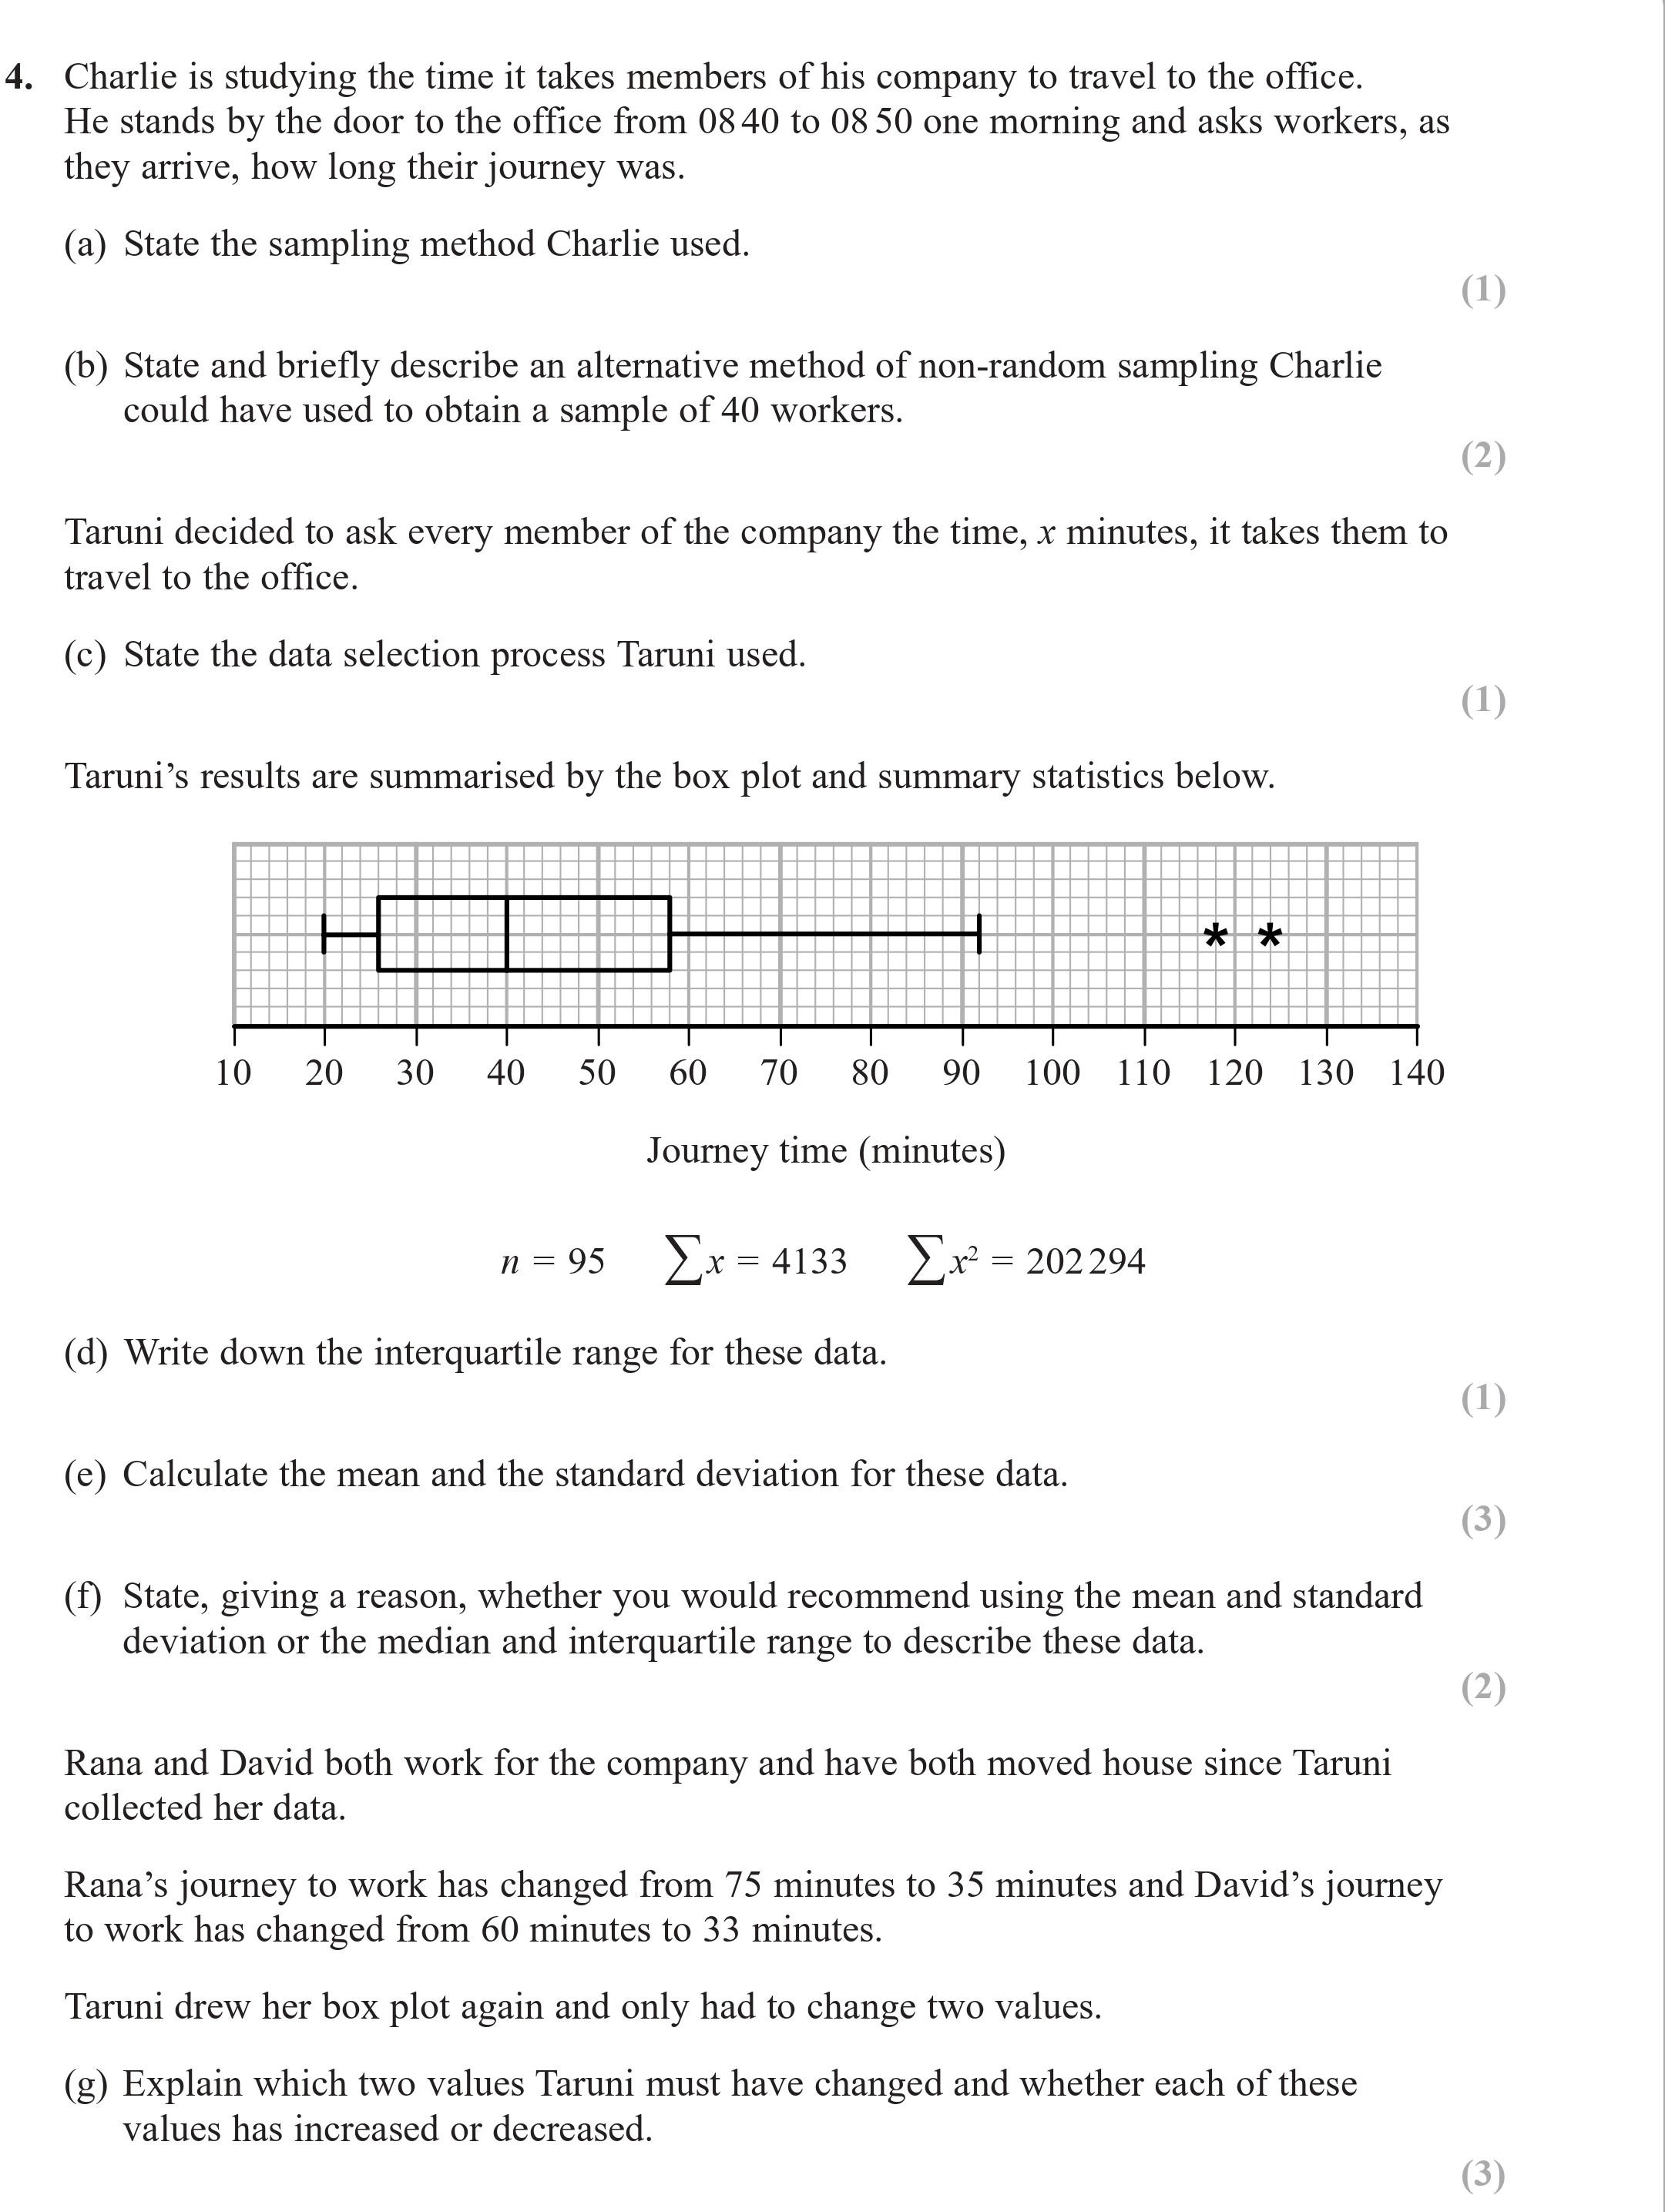
Charlie is studying the time it takes members of his company to travel to the office. He stands by the door to the office from 08:40 to 08:50 one morning and asks wo... show full transcript
Worked Solution & Example Answer:Charlie is studying the time it takes members of his company to travel to the office - Edexcel - A-Level Maths Mechanics - Question 4 - 2018 - Paper 2
Step 1

Step 2
State and briefly describe an alternative method of non-random sampling Charlie could have used to obtain a sample of 40 workers.
Answer
An alternative method is 'quota sampling,' where Charlie could set quotas for different categories (e.g., age, department) and select workers until he reaches the required number in each category, ensuring a more representative sample.
Step 3
Step 4
Write down the interquartile range for these data.
Answer
The interquartile range (IQR) can be calculated from the box plot by subtracting the first quartile (Q1) from the third quartile (Q3). Given the box plot, if Q1 is at 30 minutes and Q3 is at 70 minutes, then the IQR is: IQR = Q3 - Q1 = 70 - 30 = 40.
Step 5
Calculate the mean and the standard deviation for these data.
Answer
To calculate the mean, use the formula: ext{Mean} = rac{ ext{Sum of data}}{n} = rac{4133}{95} ext{ minutes}
For the standard deviation, use the formula: SD = ext{sqrt} rac{ ext{Sum of squares}}{n} - ( ext{Mean})^2 Substituting the values: SD = sqrt(\frac{202294}{95} - (\frac{4133}{95})^2), yielding approximately the standard deviation value.
Step 6
State, giving a reason, whether you would recommend using the mean and standard deviation or the median and interquartile range to describe these data.
Answer
Given that the data can have outliers (as shown by the box plot), it is preferable to use the median and interquartile range (IQR) to describe the data. This is because the median is less affected by extreme values, providing a better measure of central tendency for skewed distributions.
Step 7
Explain which two values Taruni must have changed and whether each of these values has increased or decreased.
Answer
The two values Taruni must have changed are the means for Rana and David's travel times. For Rana, her travel time decreased from 75 minutes to 35 minutes, while for David, his travel time decreased from 60 minutes to 33 minutes. Both values have decreased.