Charlie is studying the time it takes members of his company to travel to the office - Edexcel - A-Level Maths Mechanics - Question 4 - 2018 - Paper 1
Question 4
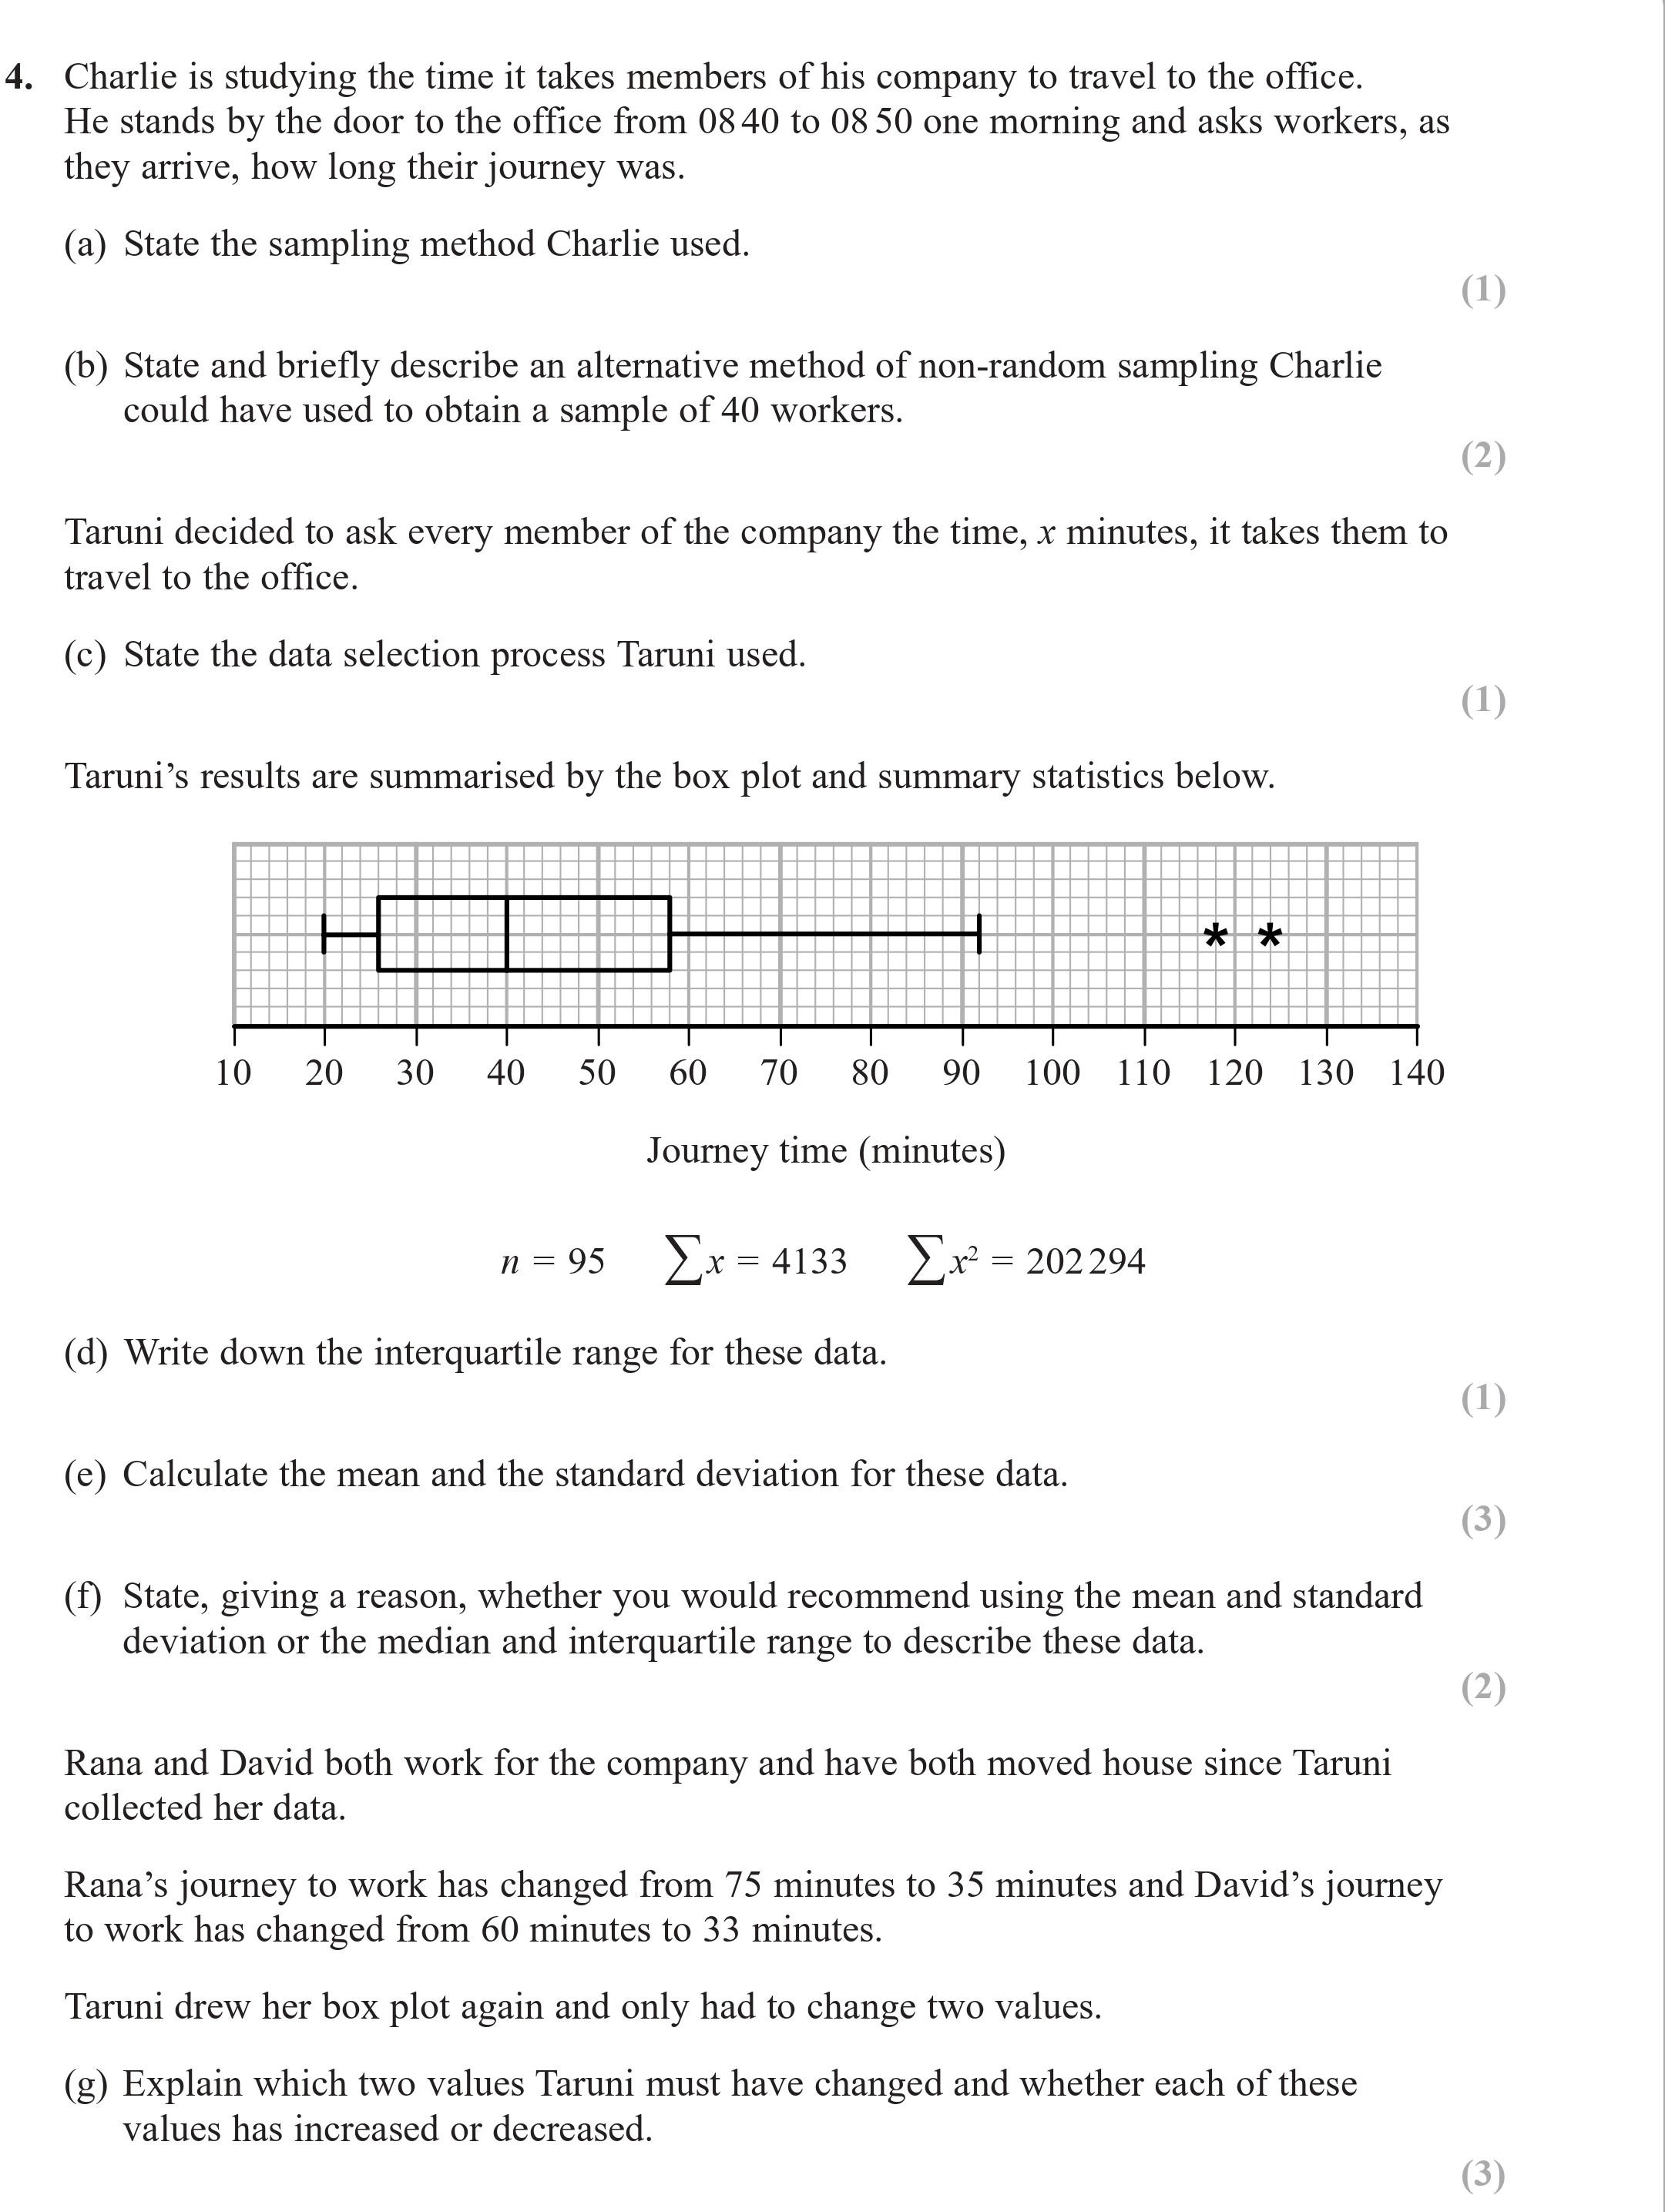
Charlie is studying the time it takes members of his company to travel to the office. He stands by the door to the office from 08:40 to 08:50 one morning and asks wo... show full transcript
Worked Solution & Example Answer:Charlie is studying the time it takes members of his company to travel to the office - Edexcel - A-Level Maths Mechanics - Question 4 - 2018 - Paper 1
Step 1
State the sampling method Charlie used.
96%
114 rated
Only available for registered users.
Sign up now to view full answer, or log in if you already have an account!
Answer
The sampling method used by Charlie was convenience sampling. He asked workers as they arrived at the office, relying on their availability during a specific time period.
Step 2
State and briefly describe an alternative method of non-random sampling Charlie could have used to obtain a sample of 40 workers.
99%
104 rated
Only available for registered users.
Sign up now to view full answer, or log in if you already have an account!
Answer
An alternative method is quota sampling. Charlie could set a quota, such as selecting four people from each department or job role, ensuring that different groups within the company are represented. This would allow for a more balanced sample.
Step 3
State the data selection process Taruni used.
96%
101 rated
Only available for registered users.
Sign up now to view full answer, or log in if you already have an account!
Answer
Taruni used a census approach by asking every member of the company about the time it takes them to travel to the office. This means every individual in the company was surveyed for their travel time.
Step 4
Write down the interquartile range for these data.
98%
120 rated
Only available for registered users.
Sign up now to view full answer, or log in if you already have an account!
Answer
To find the interquartile range (IQR), we calculate the difference between the upper quartile (Q3) and lower quartile (Q1). If Q3 is 70 and Q1 is 40, the interquartile range is calculated as:
IQR=Q3−Q1=70−40=30.
Thus, the IQR is 30 minutes.
Step 5
Calculate the mean and the standard deviation for these data.
97%
117 rated
Only available for registered users.
Sign up now to view full answer, or log in if you already have an account!
Answer
The mean (μ) can be calculated using the formula:
μ=n∑x=954133≈43.5minutes.
To calculate the standard deviation (σ), we use:
σ=n∑x2−μ2=95202294−(43.5)2≈15.4minutes.
Step 6
State, giving a reason, whether you would recommend using the mean and standard deviation or the median and interquartile range to describe these data.
97%
121 rated
Only available for registered users.
Sign up now to view full answer, or log in if you already have an account!
Answer
Given that there are outliers in the data, which can skew the mean and standard deviation, I would recommend using the median and interquartile range. The median is more robust to outliers, making it a better measure of central tendency in this case.
Step 7
Explain which two values Taruni must have changed and whether each of these values has increased or decreased.
96%
114 rated
Only available for registered users.
Sign up now to view full answer, or log in if you already have an account!
Answer
Taruni must have changed the lower quartile (Q1) and the upper quartile (Q3). With Rana's journey decreasing significantly from 75 minutes to 35 minutes, Q1 will likely decrease. David's journey, reduced from 60 minutes to 33 minutes, will cause Q3 to decrease as well due to fewer high values present in the data.