Photo AI
Figure 1 shows part of the graph of $y = f(x)$, $x \in \mathbb{R}$ - Edexcel - A-Level Maths Pure - Question 5 - 2011 - Paper 3
Question 5
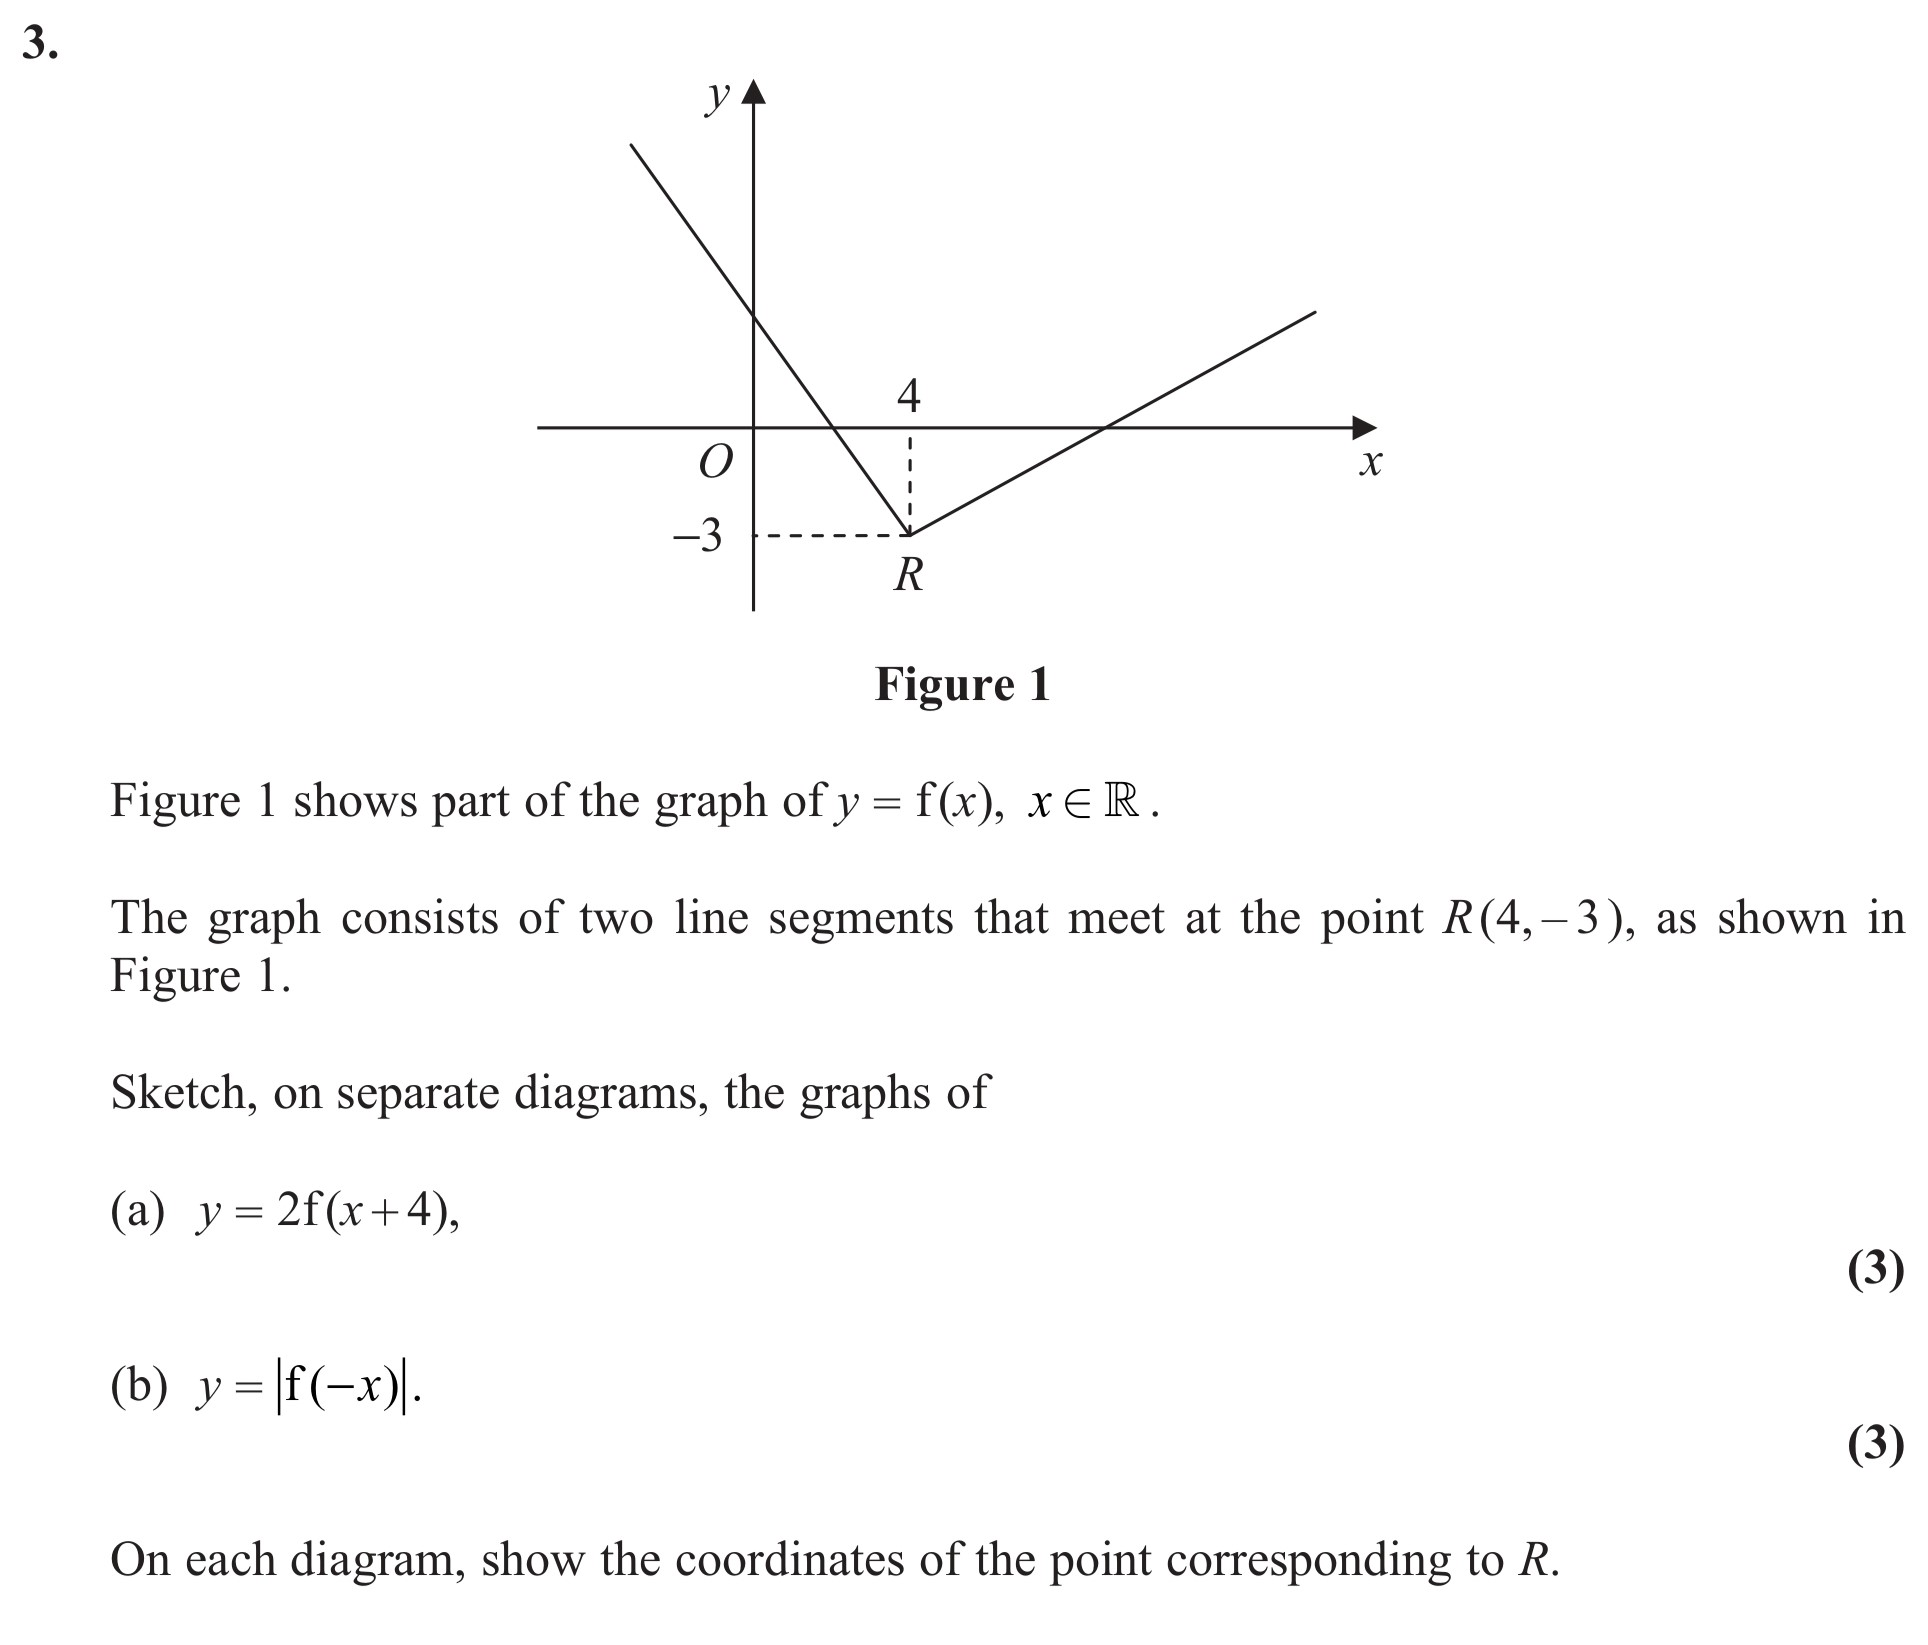
Figure 1 shows part of the graph of $y = f(x)$, $x \in \mathbb{R}$. The graph consists of two line segments that meet at the point $R(4, -3)$, as shown in Figure 1... show full transcript
Worked Solution & Example Answer:Figure 1 shows part of the graph of $y = f(x)$, $x \in \mathbb{R}$ - Edexcel - A-Level Maths Pure - Question 5 - 2011 - Paper 3
Step 1
(a) $y = 2(f(x + 4))$

Answer
To sketch the graph of , follow these steps:
-
Identify the effect of the transformation: The transformation involves a horizontal shift to the left by 4 units and a vertical stretch by a factor of 2.
-
Shift the original point R: The point shifts to the left:
- New coordinates become .
-
Apply the vertical stretch: Multiply the y-coordinate by 2:
- New coordinates become .
-
Sketch the new graph: The transformed graph will still form a V-shape, opening upwards, intersecting the y-axis at .
Step 2
(b) $y = |f(-x)|$
Answer
To sketch the graph of , follow these steps:
-
Identify the effect of the transformation: This transformation involves a reflection across the y-axis followed by taking the absolute value of the function, which ensures all values are non-negative.
-
Reflect the original point R: The point reflects to .
-
Apply the absolute value: The y-coordinate becomes positive:
- New coordinates become .
-
Sketch the new graph: The resulting graph assumes a W-shape that opens upwards, with vertices at and meaningful intersections on the x-axis, forming a downward 'V' in quadrants 1 and 2.