Photo AI
Figure 1 shows a sketch of the curve with equation $y = f(x)$, $x > 0$, where $f$ is an increasing function of $x$ - Edexcel - A-Level Maths Pure - Question 4 - 2013 - Paper 8
Question 4
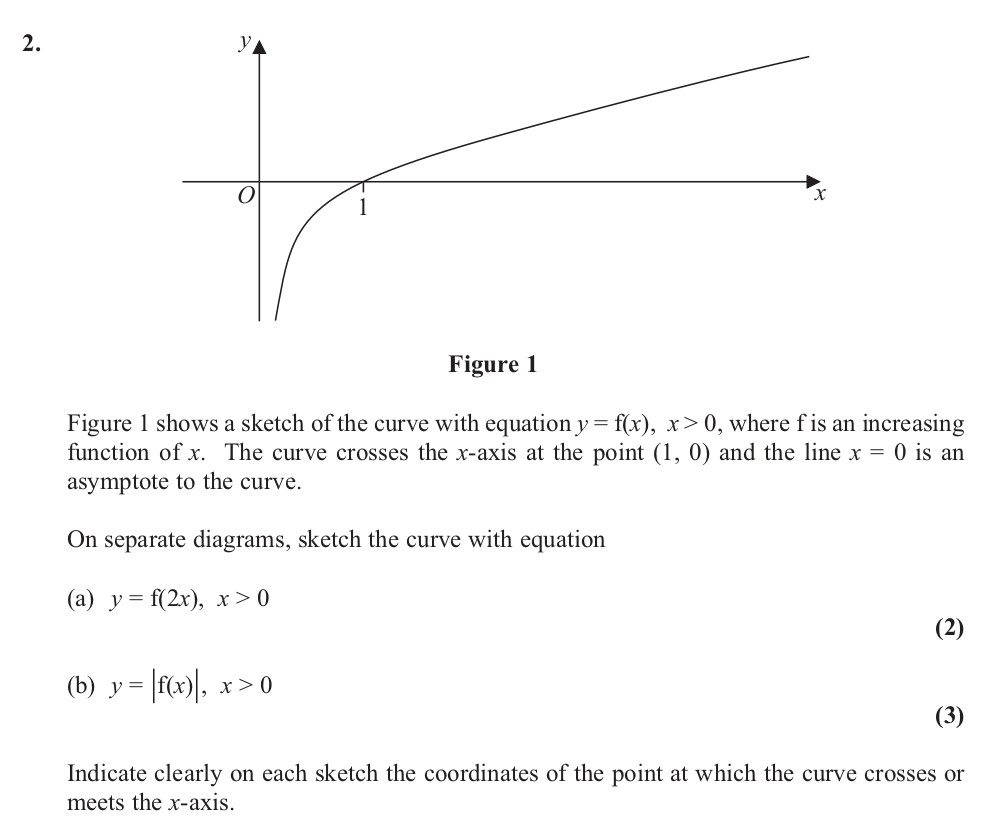
Figure 1 shows a sketch of the curve with equation $y = f(x)$, $x > 0$, where $f$ is an increasing function of $x$. The curve crosses the $x$-axis at the point $(1, ... show full transcript
Worked Solution & Example Answer:Figure 1 shows a sketch of the curve with equation $y = f(x)$, $x > 0$, where $f$ is an increasing function of $x$ - Edexcel - A-Level Maths Pure - Question 4 - 2013 - Paper 8
Step 1
Sketch the curve with equation y = f(2x), x > 0

Answer
To sketch the curve for , we need to take into account that the function is compressed horizontally by a factor of 2. The curve will cross the -axis at the point since for , . The overall shape should be an increasing function starting from the asymptote at , gently rising and crossing the -axis at .
Step 2
Sketch the curve with equation y = |f(x)|, x > 0
Answer
For the function , the result is that it remains non-negative. Since is positive for , the graph will mimic the original curve for . However, at , where crosses the -axis, the behavior changes: instead of going negative, the graph will turn up, creating a cusp at the point . Thus, the curve will approach from above, reflecting the point rather than continuing below.