Photo AI
Figure 1 shows the graph of y = f(x), 1 < x < 9 - Edexcel - A-Level Maths Pure - Question 5 - 2009 - Paper 2
Question 5
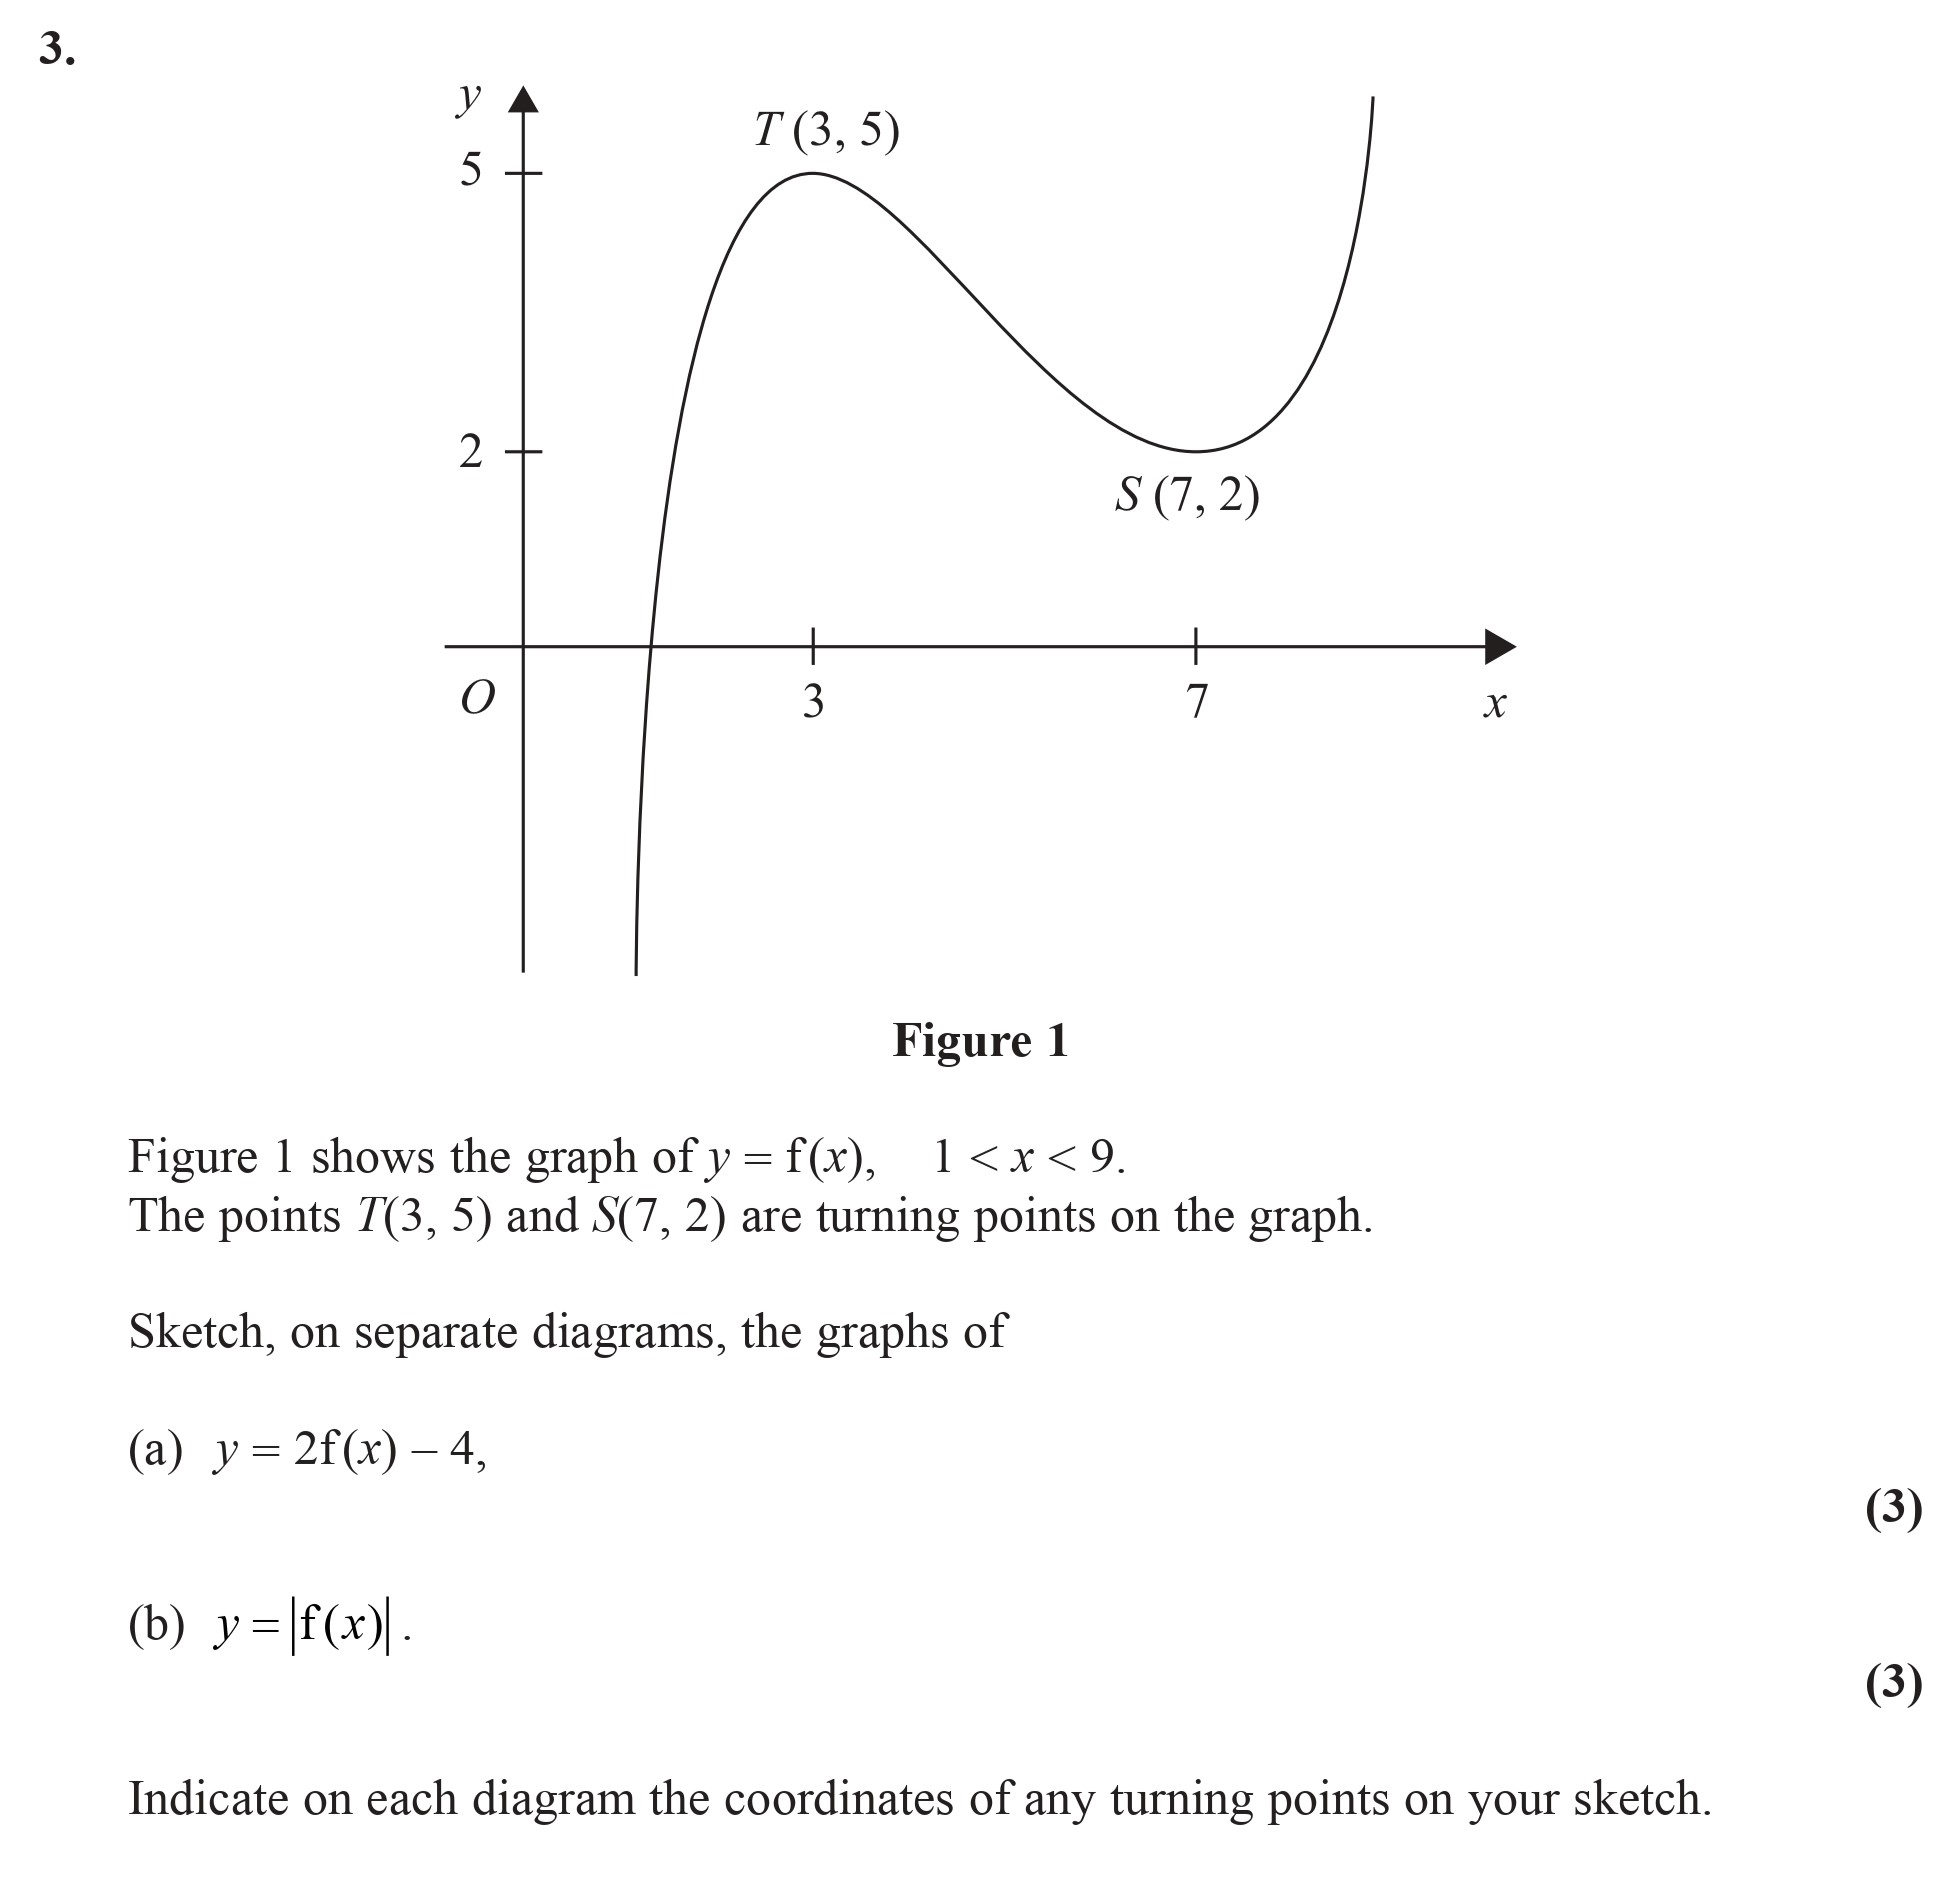
Figure 1 shows the graph of y = f(x), 1 < x < 9. The points T(3, 5) and S(7, 2) are turning points on the graph. Sketch, on separate diagrams, the graphs of (a) y... show full transcript
Worked Solution & Example Answer:Figure 1 shows the graph of y = f(x), 1 < x < 9 - Edexcel - A-Level Maths Pure - Question 5 - 2009 - Paper 2
Step 1
Sketch the graph of y = 2f(x) - 4

Answer
To sketch the graph of y = 2f(x) - 4, we first consider the original turning points of f(x), which are T(3, 5) and S(7, 2).
-
Transform the coordinates of T(3, 5):
Using the formula, the new y-coordinate will be:
So, T' = (3, 6). -
Transform the coordinates of S(7, 2):
Similarly, the new y-coordinate will be:
Therefore, S' = (7, 0). -
Graph the transformed points:
The new turning points are now T'(3, 6) and S'(7, 0). Sketch the curve ensuring it peaks at (3, 6) and drops to (7, 0).
Step 2
Sketch the graph of y = |f(x)|
Answer
For the graph of y = |f(x)|, we take into account the y-values from f(x) while ignoring any negative values:
-
Turning point T(3, 5):
This point remains the same since it’s above the x-axis. -
Turning point S(7, 2):
This point also remains the same as it is above the x-axis. -
Mirror any negative parts of the graph:
If f(x) dips below the x-axis, those sections will be reflected above the x-axis. In this case, sketch the graph such that all negative portions of f(x) are mirrored upwards. -
Indicate turning points:
On this graph, the turning points remain at T(3, 5) and S(7, 2) since those values are maintained.