Photo AI
Figure 2 shows a sketch of part of the curve with equation $y = x(x + 2)(x - 4)$ - Edexcel - A-Level Maths Pure - Question 11 - 2019 - Paper 2
Question 11
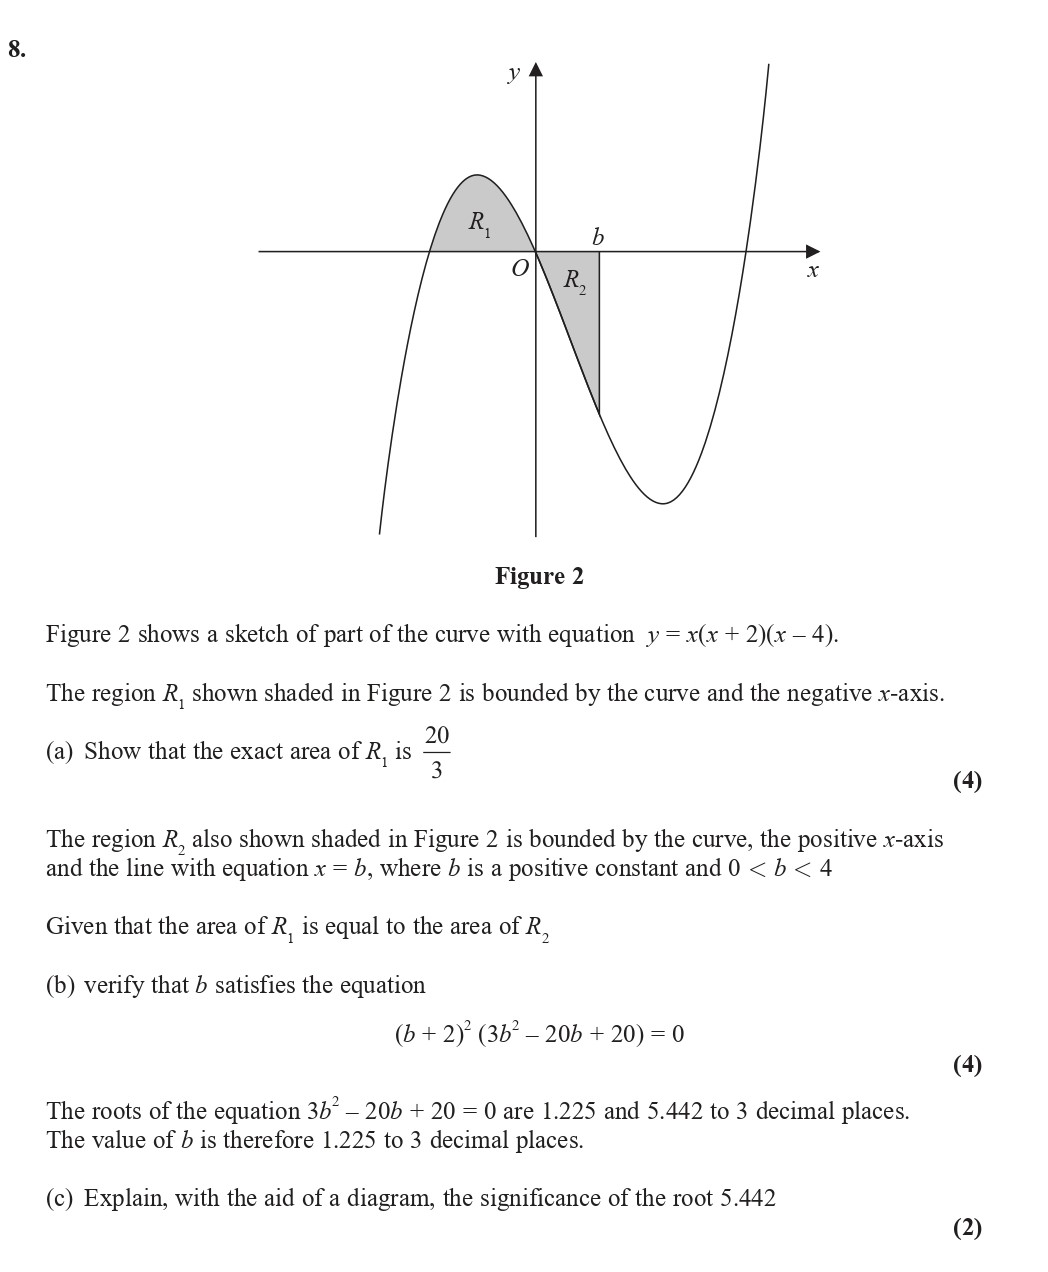
Figure 2 shows a sketch of part of the curve with equation $y = x(x + 2)(x - 4)$. The region $R_1$, shown shaded in Figure 2 is bounded by the curve and the negat... show full transcript
Worked Solution & Example Answer:Figure 2 shows a sketch of part of the curve with equation $y = x(x + 2)(x - 4)$ - Edexcel - A-Level Maths Pure - Question 11 - 2019 - Paper 2
Step 1
Show that the exact area of $R_1$ is $\frac{20}{3}$

Answer
To find the area of the region , we must evaluate the definite integral of the function from its intersection points with the x-axis. First, we expand the curve:
The area can be computed using the integral:
Calculating the integral:
-
Find the antiderivative:
-
Evaluate at the limits:
Step 2
verify that $b$ satisfies the equation $(b + 2)^2(3b^2 - 20b + 20) = 0$
Answer
To verify that satisfies the equation, we know from part (a) that the area of is . Since the area of is equal to the area of , we have:
This leads to:
-
Set up the equation:
-
Factor the quadratic equation:
Thus, we check that this verifies correctly, ensuring that or the roots of the quadratic equation contribute to .
Step 3
Explain, with the aid of a diagram, the significance of the root 5.442
Answer
The root in the polynomial equation represents a point where the area described between the curve and the x-axis up to this point reflects a distinctive area structure. In the context of the graph, it indicates that at , the area under the curve changes significantly, giving it a distinct value.
- Create a diagram that shows the curve from to .
- Shade the area between the curve and the x-axis to illustrate regions and .
- Highlight the point on the diagram to visualize where this area lies, emphasizing how it influences the total area calculation.