Photo AI
f(x) = x^4 - 4x - 8 - Edexcel - A-Level Maths Pure - Question 7 - 2007 - Paper 6
Question 7
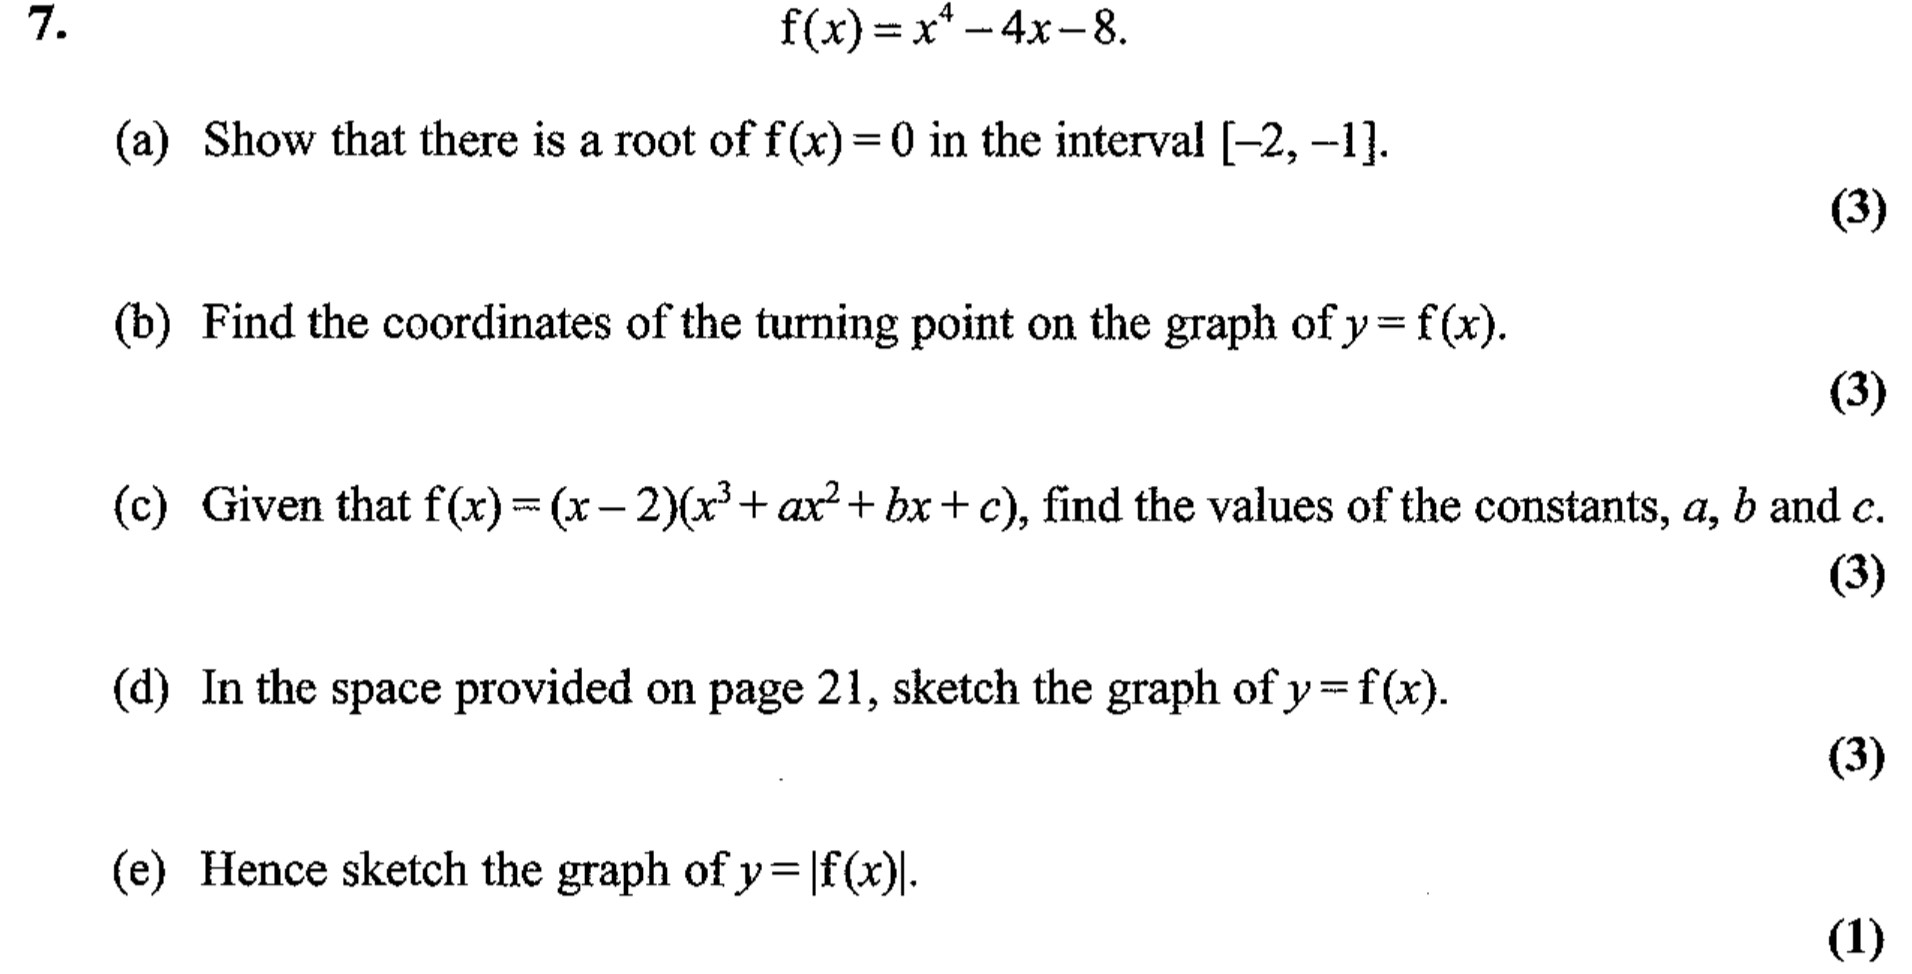
f(x) = x^4 - 4x - 8. (a) Show that there is a root of f(x) = 0 in the interval [-2, -1]. (b) Find the coordinates of the turning point on the graph of y = f(x). (... show full transcript
Worked Solution & Example Answer:f(x) = x^4 - 4x - 8 - Edexcel - A-Level Maths Pure - Question 7 - 2007 - Paper 6
Step 1
Show that there is a root of f(x) = 0 in the interval [-2, -1]

Answer
To show that there is a root in the interval [-2, -1], we evaluate f(-2) and f(-1):
-
Calculate f(-2):
-
Calculate f(-1):
Since f(-2) > 0 and f(-1) < 0, by the Intermediate Value Theorem, there is at least one root in the interval [-2, -1].
Step 2
Find the coordinates of the turning point on the graph of y = f(x)
Answer
First, we find the derivative of f(x):
Setting the derivative equal to zero to find turning points:
Now we substitute x = 1 back into f(x) to find the coordinates:
Thus, the coordinates of the turning point are (1, -11).
Step 3
Given that f(x) = (x - 2)(x^2 + ax^2 + bx + c), find the values of the constants, a, b, and c
Answer
Expanding the expression:
From f(x) = x^4 - 4x - 8, we can equate coefficients:
-
Coefficient of : a - 2 = 0
-
Coefficient of : b - 2a = 0
-
Constant term: -2c = -8
Thus, the values are: a = 2, b = 4, c = 4.
Step 4
In the space provided on page 21, sketch the graph of y = f(x)
Answer
To sketch the graph of y = f(x), we plot the turning point at (1, -11) and identify the behavior as x approaches ±∞. The graph will approach +∞ as x approaches ±∞ due to the positive leading coefficient. It intersects the y-axis at f(0) = -8. The overall shape resembles a quartic polynomial with one local maximum and one local minimum.
Step 5
Hence sketch the graph of y = |f(x)|
Answer
The graph of y = |f(x)| will reflect any part of the graph of y = f(x) that is below the x-axis. Starting from the turning point, the portions of the graph below the x-axis will be flipped above the x-axis. Conventional points where f(x) ≤ 0 will be shown on the upper half of the graph, creating a 'U' shape for those areas, while all other parts remain unchanged.