Photo AI

Figure 1 shows a sketch of the graph of $y = f(x)$ - Edexcel - A-Level Maths Pure - Question 8 - 2010 - Paper 2

Question icon

Question 8

Figure-1-shows-a-sketch-of-the-graph-of-$y-=-f(x)$-Edexcel-A-Level Maths Pure-Question 8-2010-Paper 2.png

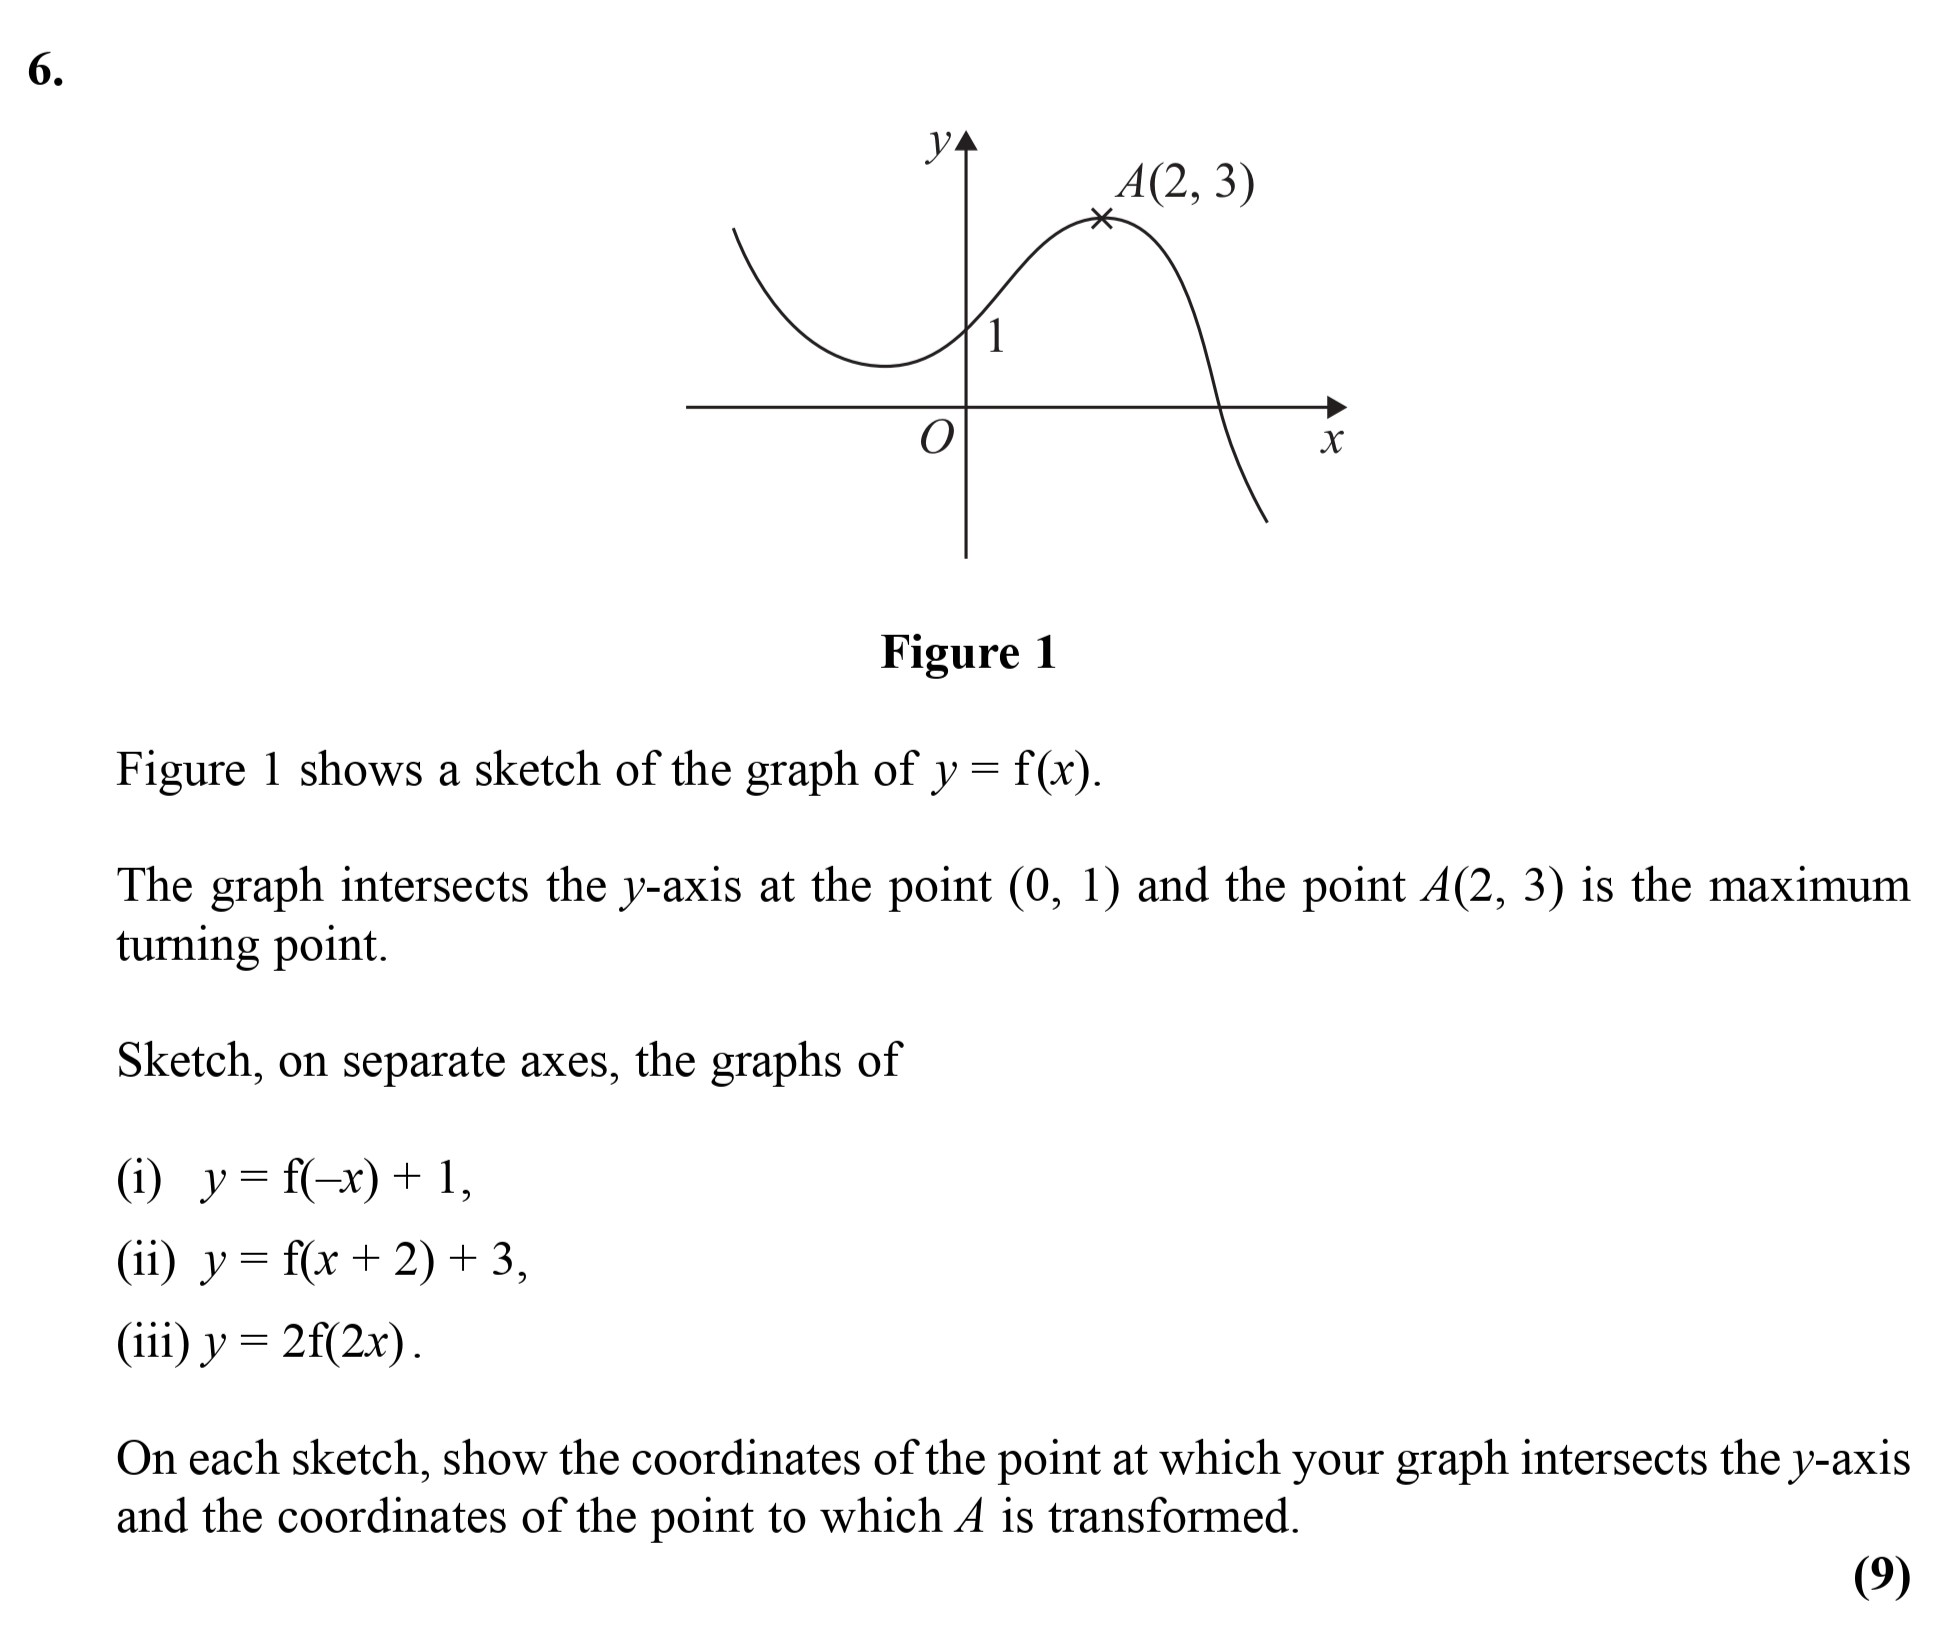
Figure 1 shows a sketch of the graph of $y = f(x)$. The graph intersects the $y$-axis at the point $(0, 1)$ and the point $A(2, 3)$ is the maximum turning point. ... show full transcript

Worked Solution & Example Answer:Figure 1 shows a sketch of the graph of $y = f(x)$ - Edexcel - A-Level Maths Pure - Question 8 - 2010 - Paper 2

Step 1

(i) y = f(-x) + 1

96%

114 rated

Answer

To sketch the graph of y=f(x)+1y = f(-x) + 1, we first reflect the original graph across the yy-axis, which results in the graph having a maximum at A(2,3)A'(-2, 3). Then, translating the graph up by 1 unit results in the new maximum point being at A(2,4)A'(-2, 4). The yy-intercept, originally at (0,1)(0, 1), remains the same.

Step 2

(ii) y = f(x + 2) + 3

99%

104 rated

Answer

For the graph of y=f(x+2)+3y = f(x + 2) + 3, we first translate the original graph to the left by 2 units. The maximum point A(2,3)A(2, 3) translates to A(0,3)A'(0, 3). Then, we raise the entire graph by 3 units, so the new maximum point becomes A(0,6)A'(0, 6). The yy-intercept shifts from (0,1)(0, 1) to (0,4)(0, 4).

Step 3

(iii) y = 2f(2x)

96%

101 rated

Answer

To graph y=2f(2x)y = 2f(2x), we first compress the graph horizontally by a factor of 2, affecting the maximum point. The new maximum from the original at A(2,3)A(2, 3) moves to A(1,3)A'(1, 3). Then, the graph is vertically stretched by a factor of 2, moving AA' to A(1,6)A'(1, 6). The yy-intercept also changes, scaling from (0,1)(0, 1) to (0,2)(0, 2).

Join the A-Level students using SimpleStudy...

97% of Students

Report Improved Results

98% of Students

Recommend to friends

100,000+

Students Supported

1 Million+

Questions answered

;