A scientist is researching whether or not birds of prey exposed to pollutants lay eggs with thinner shells - Edexcel - A-Level Maths Statistics - Question 3 - 2012 - Paper 2
Question 3
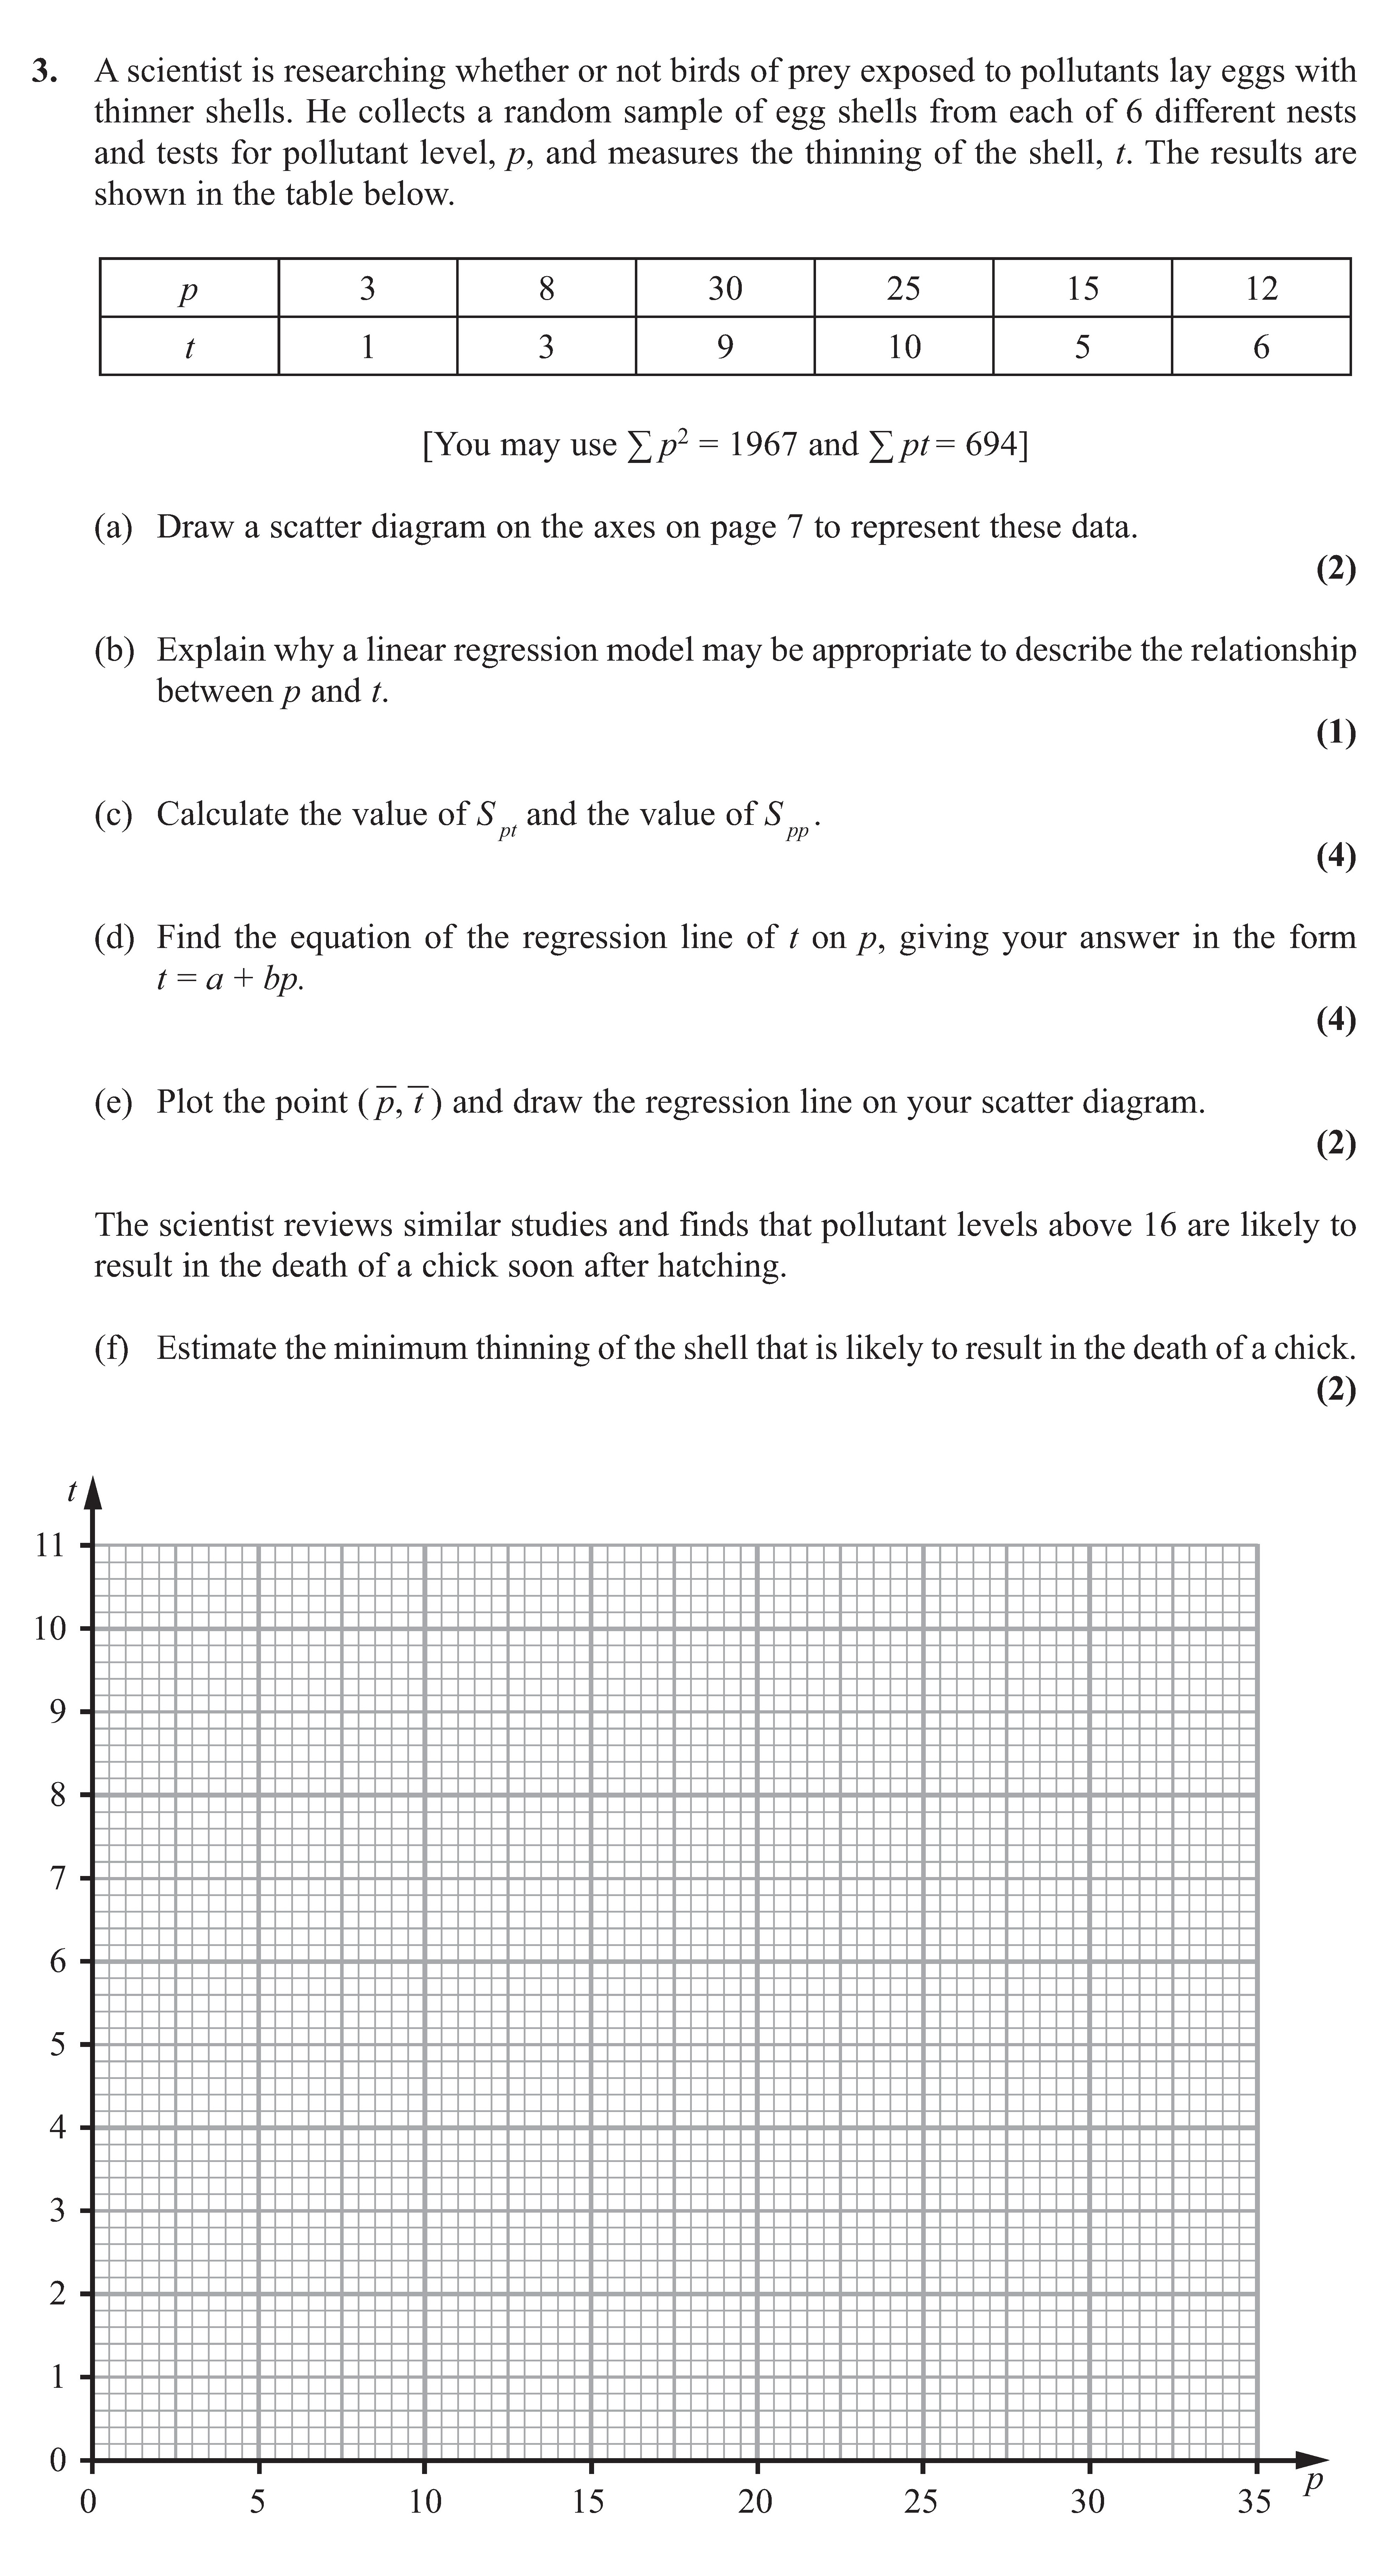
A scientist is researching whether or not birds of prey exposed to pollutants lay eggs with thinner shells. He collects a random sample of egg shells from each of 6 ... show full transcript
Worked Solution & Example Answer:A scientist is researching whether or not birds of prey exposed to pollutants lay eggs with thinner shells - Edexcel - A-Level Maths Statistics - Question 3 - 2012 - Paper 2
Step 1
a) Draw a scatter diagram on the axes
96%
114 rated
Only available for registered users.
Sign up now to view full answer, or log in if you already have an account!
Answer
To draw the scatter diagram, plot the pollutant levels (p) on the x-axis and the thinning of the shell (t) on the y-axis. Each data point corresponds to the pairs (3, 1), (8, 3), (30, 9), (25, 10), (15, 5), and (2, 6). Clearly label your axes and ensure each point is accurately plotted.
Step 2
b) Explain why a linear regression model may be appropriate
99%
104 rated
Only available for registered users.
Sign up now to view full answer, or log in if you already have an account!
Answer
A linear regression model may be appropriate because the scatter diagram reveals a roughly linear relationship between the pollutant level (p) and the thinning of the shell (t). The points appear to cluster around a straight line, which suggests that increases in p are associated with increases in t, indicating a strong correlation.
Step 3
c) Calculate the value of $S_p$ and the value of $S_{pp}$
96%
101 rated
Only available for registered users.
Sign up now to view full answer, or log in if you already have an account!
Answer
To calculate Sp and Spp:
For Sp: Sum the pollutant levels:
Sp=3+8+30+25+15+2=83
For Spp: Compute the sum of squares of pollutant levels:
Spp=32+82+302+252+152+22=9+64+900+625+225+4=1827
Step 4
d) Find the equation of the regression line of $t$ on $p$
98%
120 rated
Only available for registered users.
Sign up now to view full answer, or log in if you already have an account!
Answer
To find the regression line of t on p, use the formulas for the slope (b) and intercept (a). The slope is calculated as:
b=SppSpt
Substituting in the values:
Spt=∑(pi−pˉ)(ti−tˉ)
The equation of the line will be:
t=a+bp
Step 5
e) Plot the point $(\bar{p}, \bar{t})$
97%
117 rated
Only available for registered users.
Sign up now to view full answer, or log in if you already have an account!
Answer
Calculate the mean values (pˉ,tˉ). Then, plot this point on the scatter diagram. Draw the regression line that represents the relationship based on the calculated slope and intercept.
Step 6
f) Estimate the minimum thinning of the shell that is likely to result in the death of a chick
97%
121 rated
Only available for registered users.
Sign up now to view full answer, or log in if you already have an account!
Answer
To estimate the minimum thinning that likely results in the death of a chick, find the corresponding value of t when p=16. Use the derived regression equation and solve for t when p=16, leading to