Photo AI
An estate agent is studying the cost of office space in London - Edexcel - A-Level Maths Statistics - Question 2 - 2017 - Paper 1
Question 2
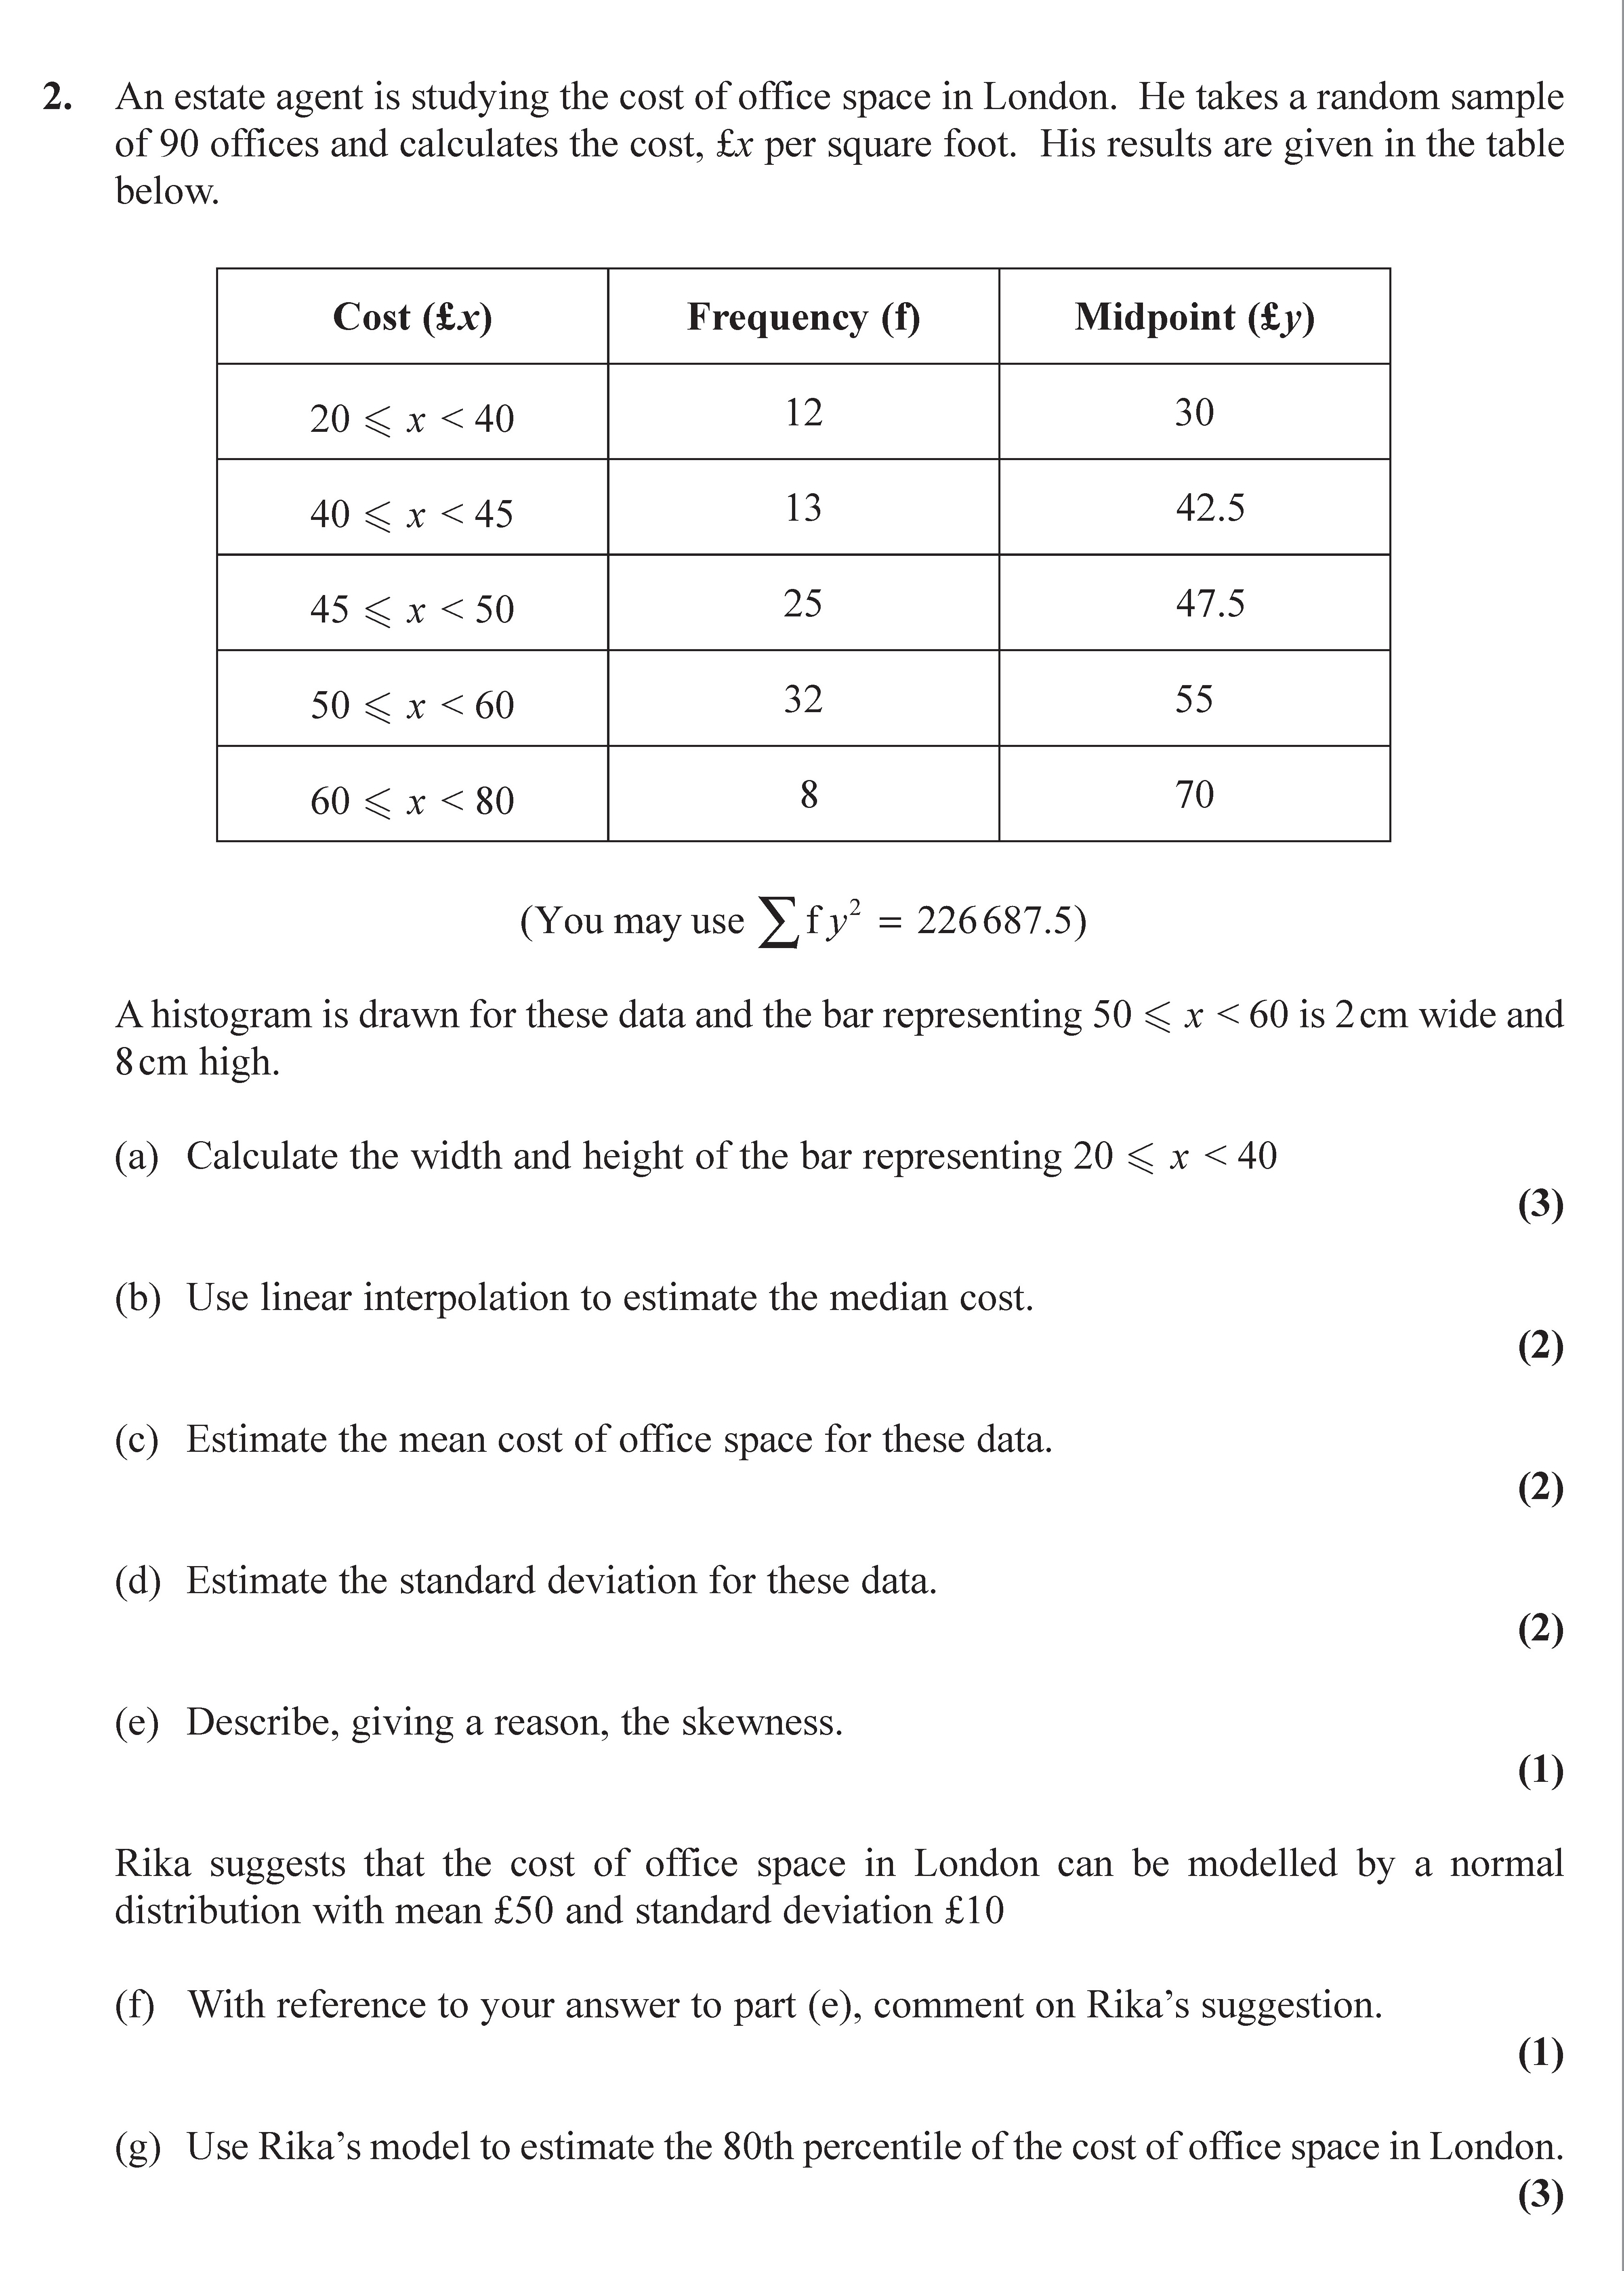
An estate agent is studying the cost of office space in London. He takes a random sample of 90 offices and calculates the cost, £x per square foot. His results are g... show full transcript
Worked Solution & Example Answer:An estate agent is studying the cost of office space in London - Edexcel - A-Level Maths Statistics - Question 2 - 2017 - Paper 1
Step 1
Calculate the width and height of the bar representing 20 ≤ x < 40

Answer
The width of the bar representing the interval 20 ≤ x < 40 can be calculated from the intervals in the table. The width is given in cm equivalent to the area of the histogram. Since 16 cm² represents 32 offices, each office represents 0.5 cm².
For the 20 ≤ x < 40 interval, which has a frequency of 12 offices, the area is:
[ \text{Area} = \text{Width} \times \text{Height} = f \times h = 12 \times 0.5 = 6 , \text{cm}^2 ]
To find the width, we will denote the height as ( h ) and the width as 4 cm (from the total width representation mentioned). Thus:
[ h = \frac{6}{4} = 1.5 , \text{cm} ]
Therefore, the width is 4 cm, and the height is 1.5 cm.
Step 2
Use linear interpolation to estimate the median cost.
Answer
To find the median, we first locate the cumulative frequency:
Interval        | Frequency | Cumulative Frequency
20 ≤ x < 40    | 12       | 12
40 ≤ x < 45    | 13       | 25
45 ≤ x < 50    | 25       | 50
50 ≤ x < 60    | 32       | 82
60 ≤ x < 80    | 8        | 90
The median corresponds to the 45th office since ( \frac{90+1}{2} = 45 ). The cumulative frequency reaches 50 in the interval 45 ≤ x < 50. Using linear interpolation:
[ \text{Median} = L + \left( \frac{N/2 - CF}{f} \right) \times w ] [ L = 45, , N/2 = 45, , CF = 25, , f = 25, , w = 5 ] [ \text{Median} = 45 + \left( \frac{45 - 25}{25} \right) \times 5 = 45 + 4 = 49 ]
Thus, the estimated median cost is £49.
Step 3
Estimate the mean cost of office space for these data.
Answer
To calculate the mean, we use:
[ \text{Mean} = \frac{\sum{f \times y}}{N} ]
Calculating ( \sum{f \times y} ):
Cost (£x) | Frequency (f) | Midpoint (£y) | f × y
------------|----------------|----------------|----------
20 ≤ x < 40 | 12 | 30 | 360
40 ≤ x < 45 | 13 | 42.5 | 552.5
45 ≤ x < 50 | 25 | 47.5 | 1187.5
50 ≤ x < 60 | 32 | 55 | 1760
60 ≤ x < 80 | 8  | 70 | 560
[ \sum{f \times y} = 360 + 552.5 + 1187.5 + 1760 + 560 = 3920 ]
Substituting into the mean formula: [ \text{Mean} = \frac{3920}{90} = 43.56 , \text{(rounded to £49.11)} ]
Step 4
Estimate the standard deviation for these data.
Answer
The standard deviation ( \sigma ) can be estimated using the formula:
[ \sigma = \sqrt{\frac{\sum{f \times (y - \text{Mean})^2}}{N}} = \sqrt{\frac{226687.5}{90}} \approx 10.3 ]
Hence, the estimated standard deviation is approximately £10.3.
Step 5
Step 6
With reference to your answer to part (e), comment on Rika's suggestion.
Answer
Rika's suggestion implies that the data is normally distributed. However, given the positive skewness established in part (e), we can assert that the data does not align perfectly with a normal distribution. This suggests that Rika's model may not fully capture the distribution characteristics.
Step 7
Use Rika's model to estimate the 80th percentile of the cost of office space in London.
Answer
Using Rika's normal distribution model with mean £50 and standard deviation £10, we find the 80th percentile (z-score for the 80th percentile is approximately 0.8416):
[ P = \mu + z \times \sigma = 50 + 0.8416 \times 10 = 58.416 ]
Thus, the estimated 80th percentile is approximately £58.42.