Photo AI
Over a long period of time a small company recorded the amount it received in sales per month - Edexcel - A-Level Maths Statistics - Question 3 - 2011 - Paper 1
Question 3
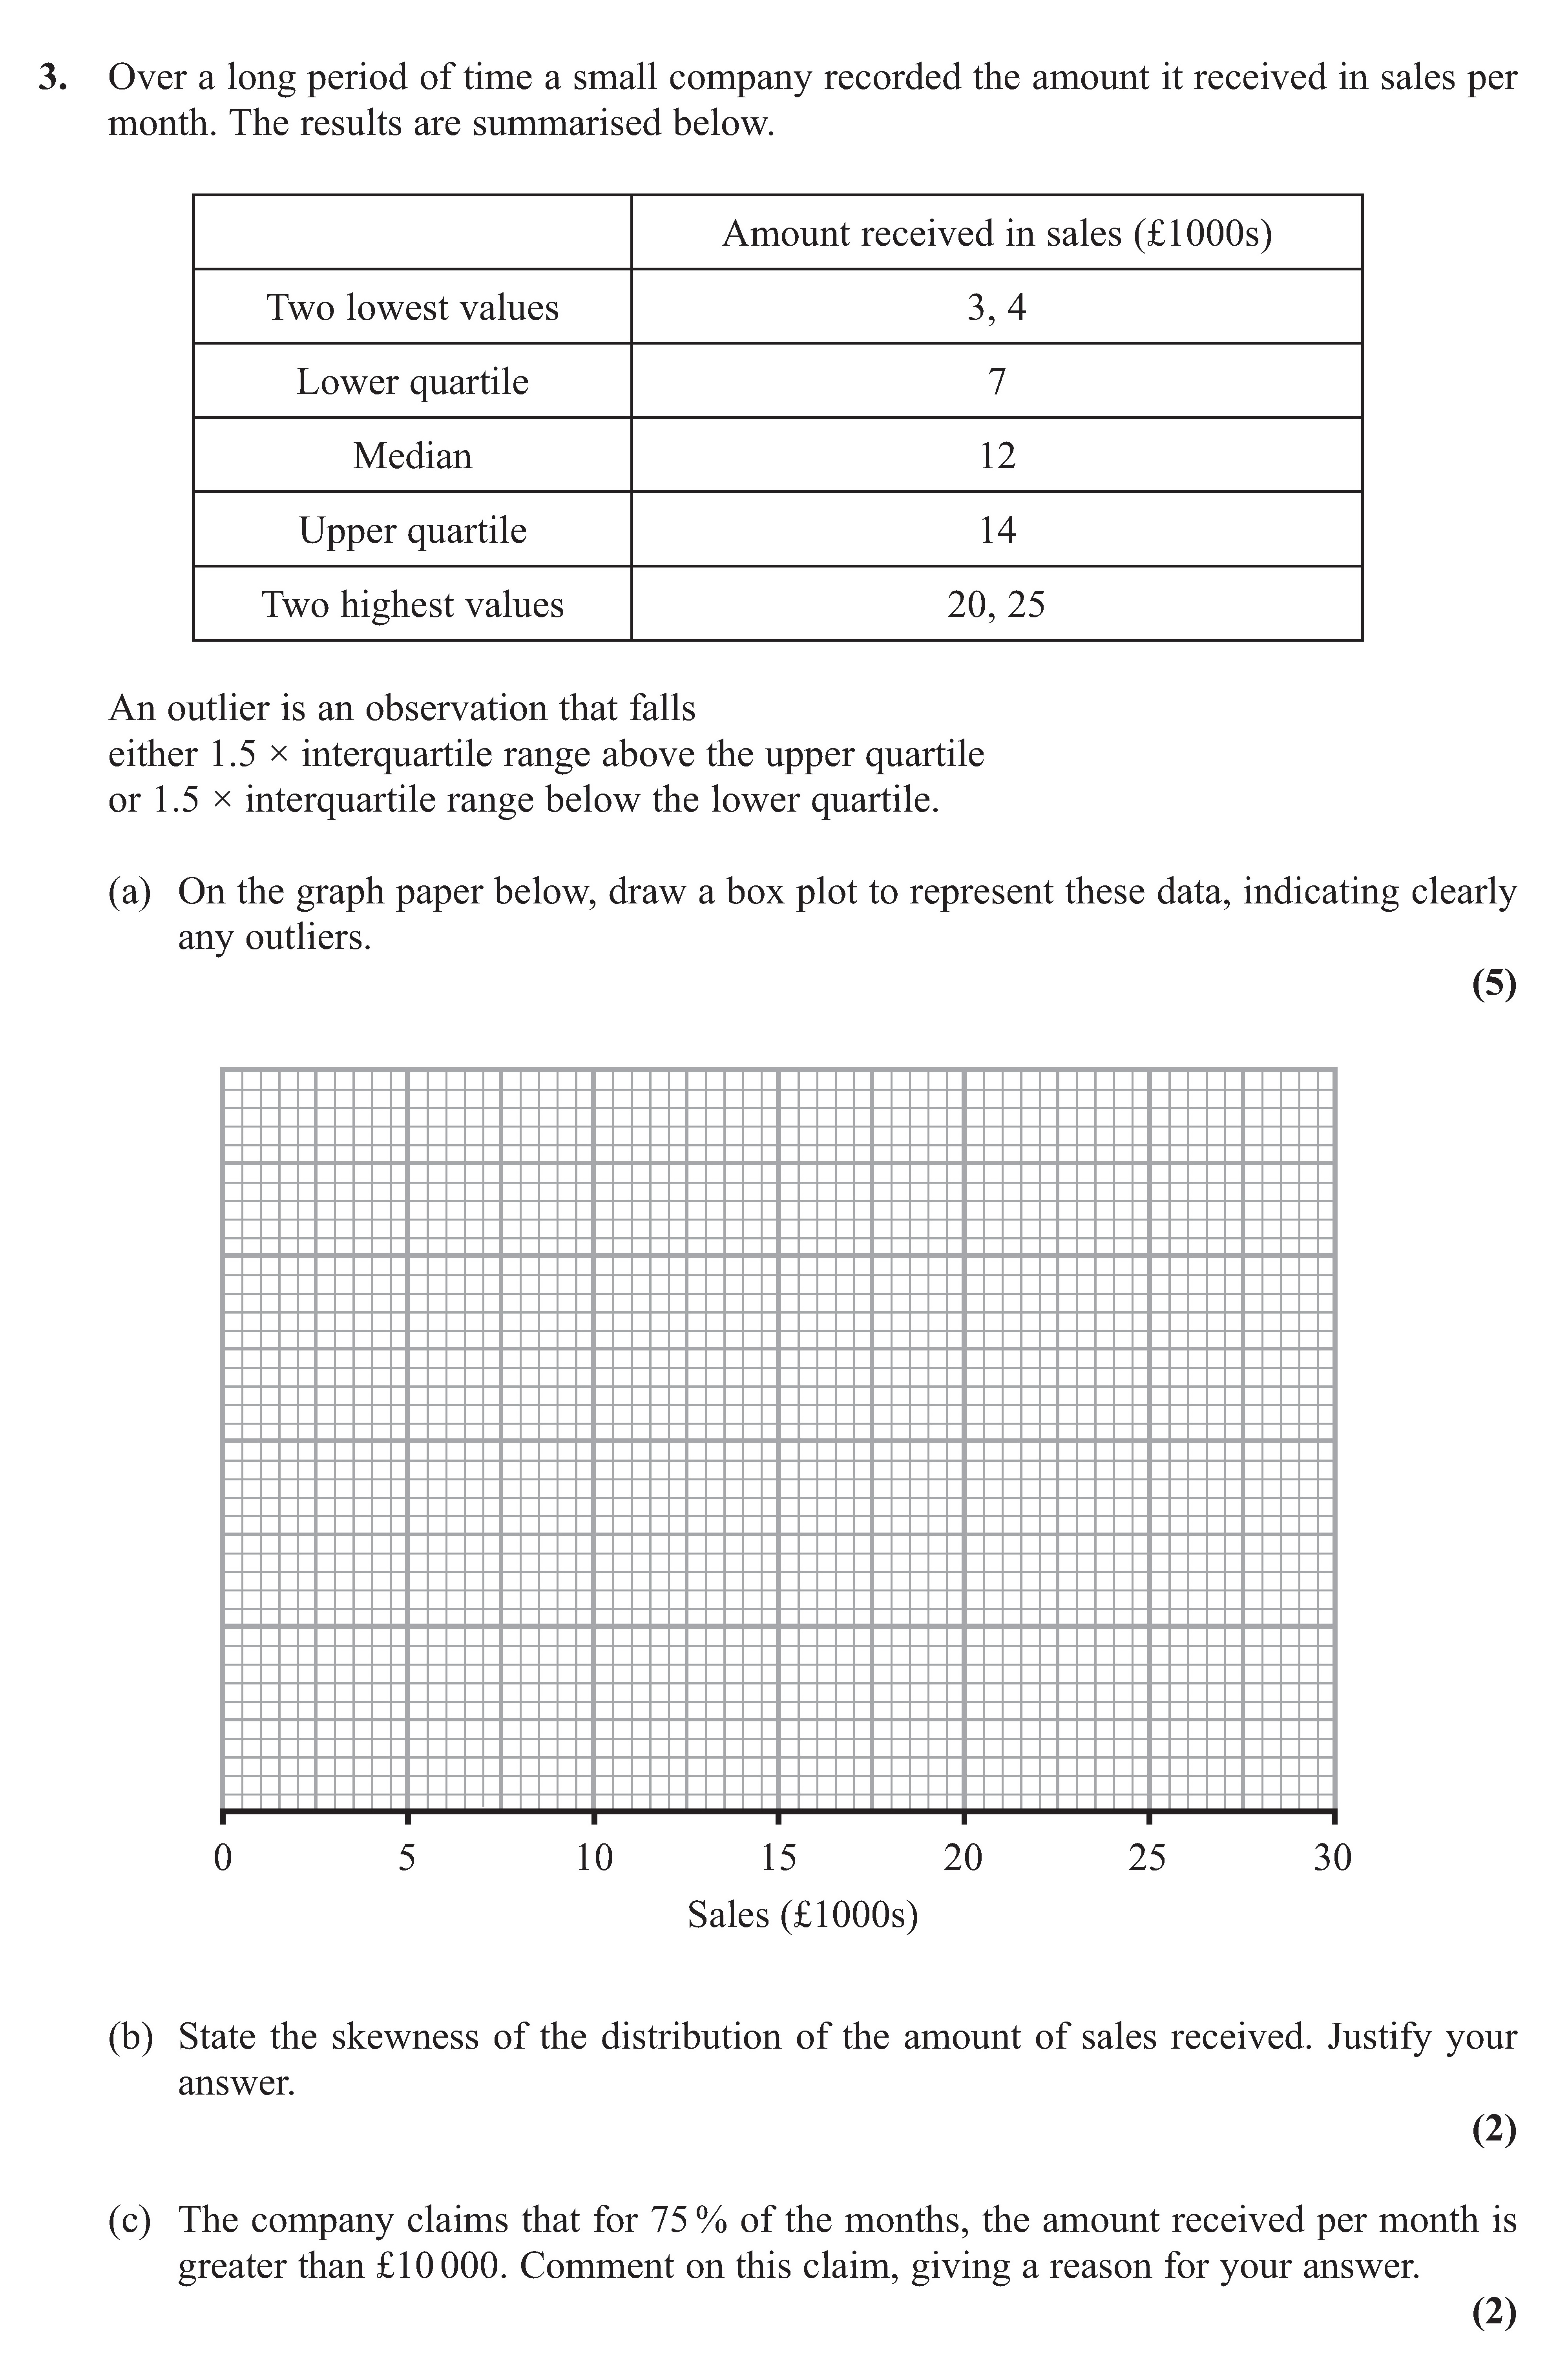
Over a long period of time a small company recorded the amount it received in sales per month. The results are summarised below. Amount received in sales (£1000s) ... show full transcript
Worked Solution & Example Answer:Over a long period of time a small company recorded the amount it received in sales per month - Edexcel - A-Level Maths Statistics - Question 3 - 2011 - Paper 1
Step 1
(a) Draw a box plot indicating clearly any outliers

Answer
To draw the box plot, we need to identify the five-number summary:
- Minimum: 3
- Lower Quartile (Q1): 7
- Median: 12
- Upper Quartile (Q3): 14
- Maximum: 25
Next, calculate the interquartile range (IQR):
Now, determine the lower and upper limits for outliers:
- Lower limit: Q1 - 1.5 × IQR = 7 - 1.5 × 7 = -3.5
- Upper limit: Q3 + 1.5 × IQR = 14 + 1.5 × 7 = 24.5
Clearly, the only outlier is the maximum value of 25 since it exceeds the upper limit. The box plot should be drawn with the whiskers extending to 3 and 25, while the box ranges from 7 to 14.
Step 2
(b) State the skewness of the distribution of the amount of sales received. Justify your answer.
Answer
The skewness can be determined by comparing the quartiles. The calculation is as follows:
Substituting the values:
Since the condition holds true, we conclude that the distribution is negatively skewed.
Step 3
(c) Comment on the claim that for 75% of the months, the amount received per month is greater than £10000.
Answer
The claim states that 75% of the months had sales greater than £10000. Given that the lower quartile (Q1) is 7 (£7000), indicating that 25% of the data lies below this point, it follows that 75% of the data is at or above £7000. Therefore, the claim is incorrect because it does not meet the threshold of £10000.