Photo AI
The histogram in Figure 1 shows the time taken, to the nearest minute, for 140 runners to complete a fun run - Edexcel - A-Level Maths Statistics - Question 3 - 2008 - Paper 1
Question 3
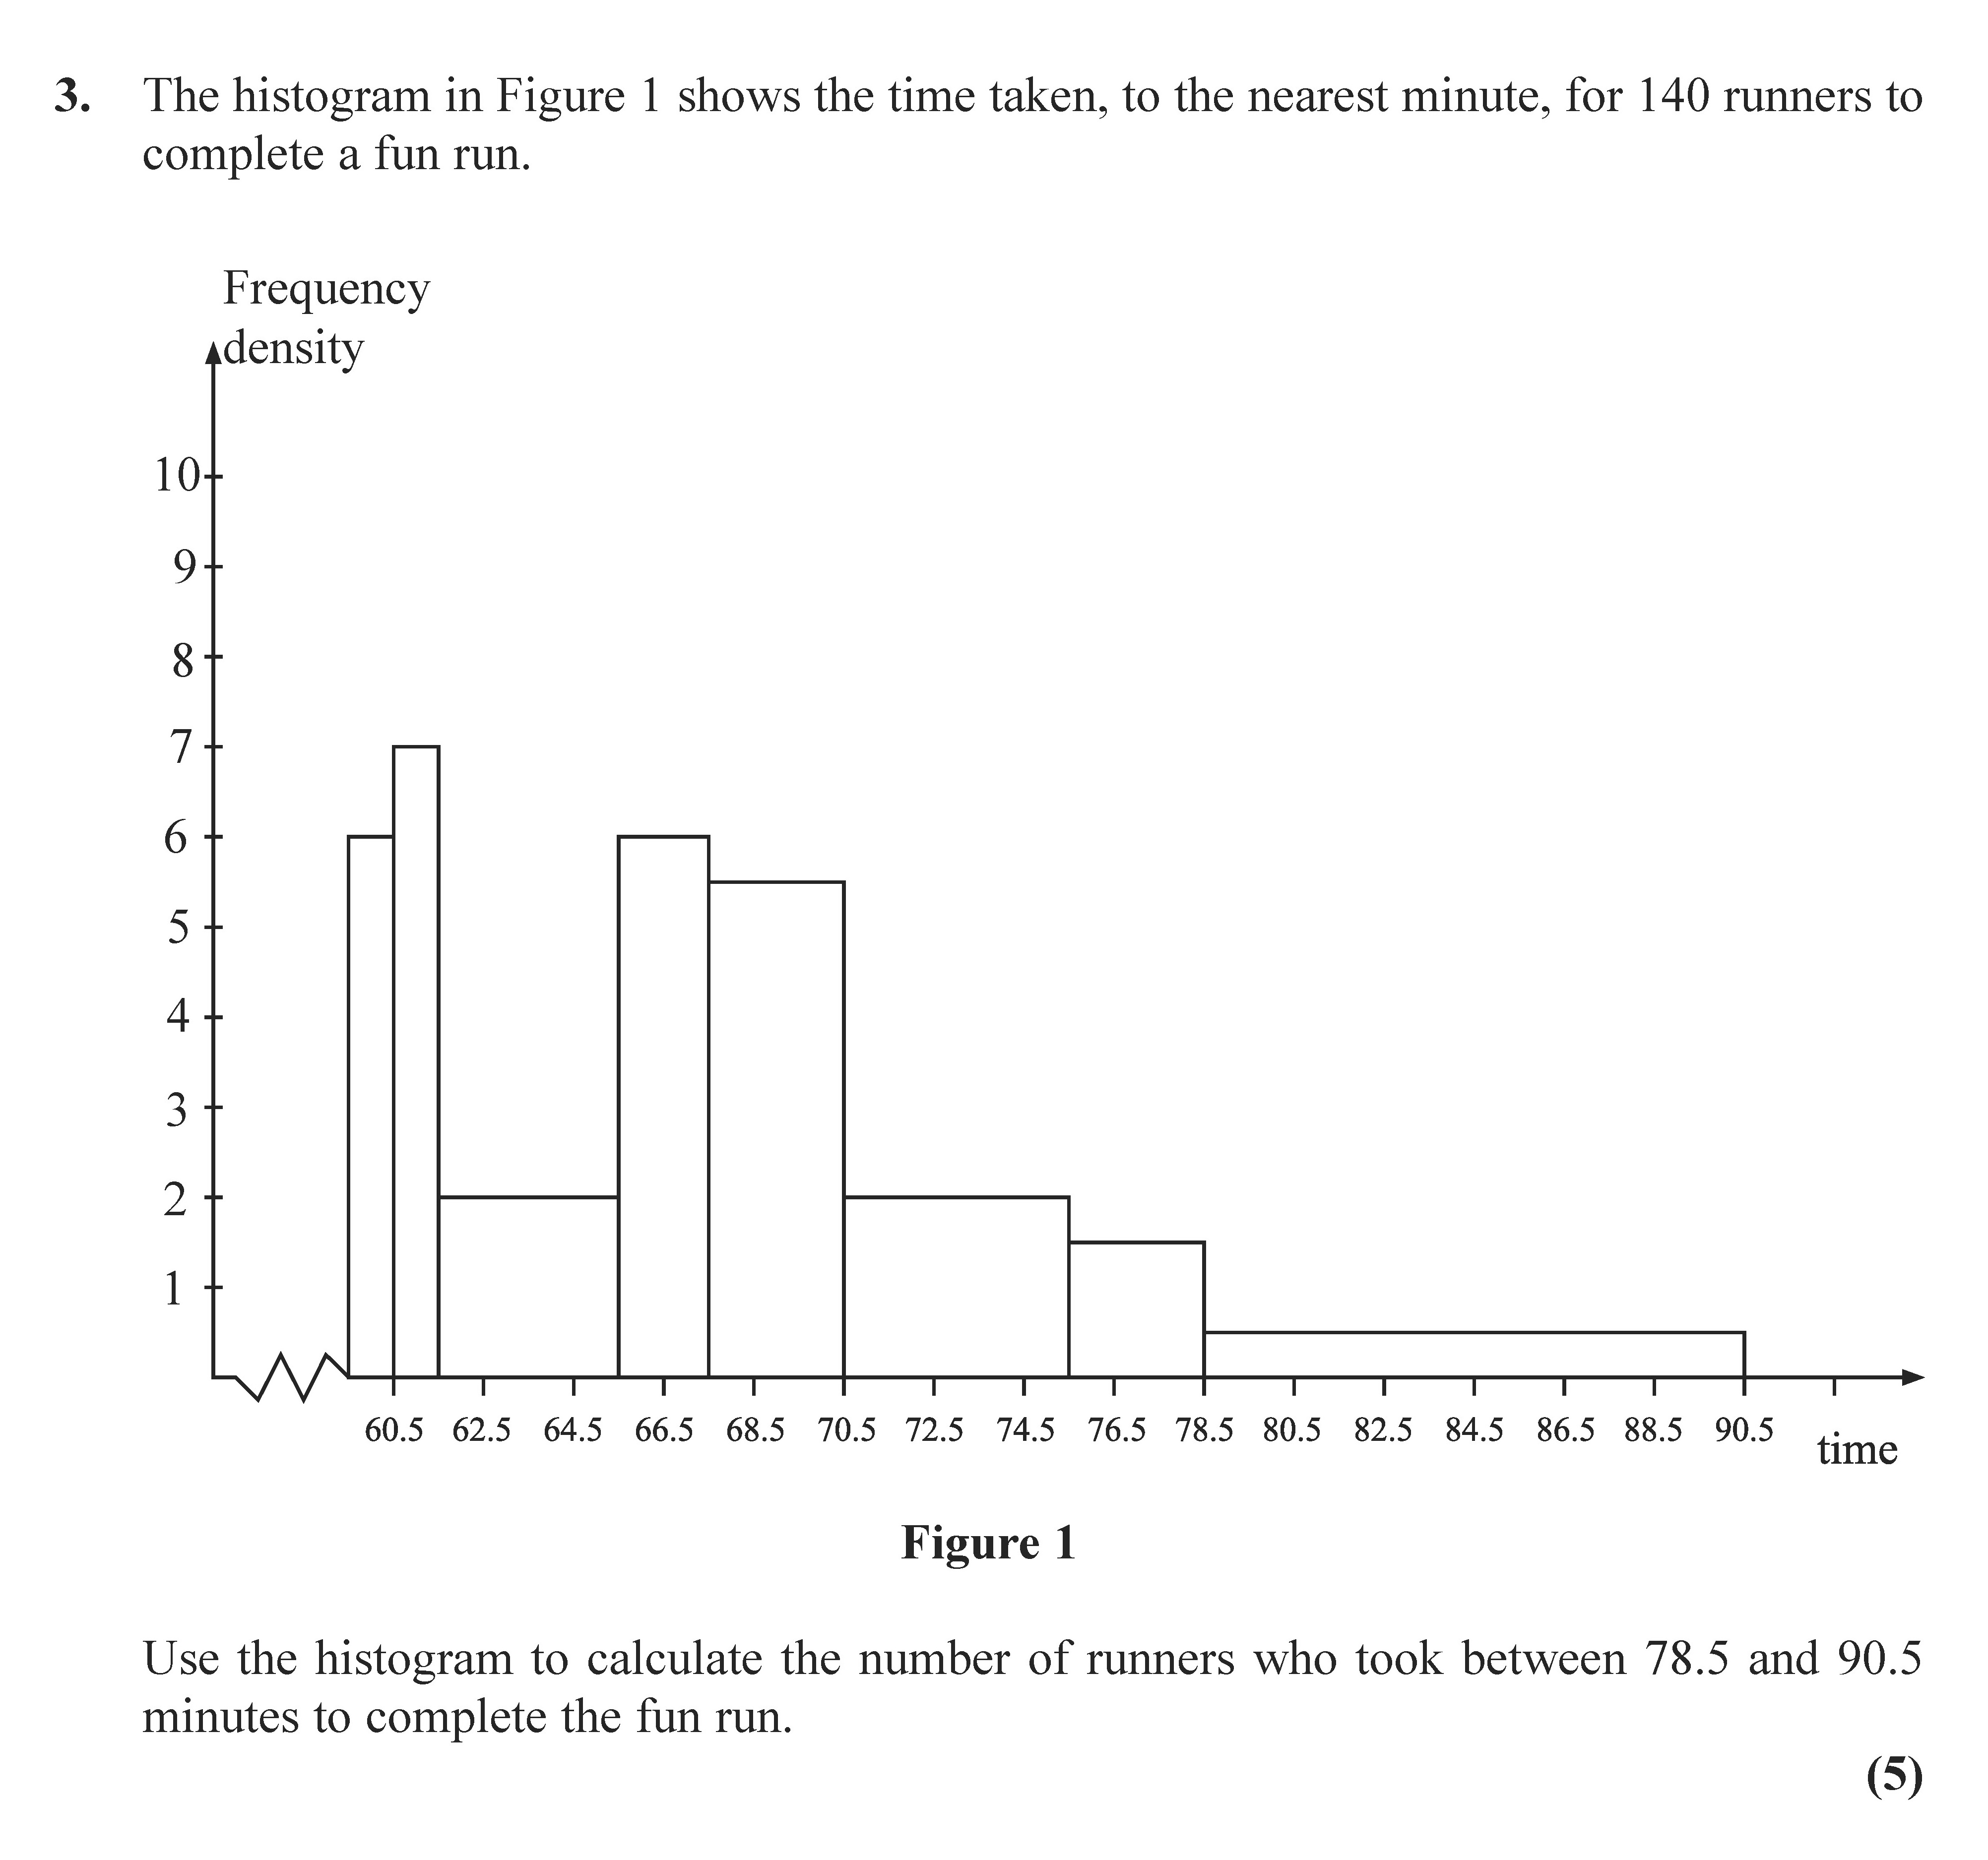
The histogram in Figure 1 shows the time taken, to the nearest minute, for 140 runners to complete a fun run. Use the histogram to calculate the number of runners w... show full transcript
Worked Solution & Example Answer:The histogram in Figure 1 shows the time taken, to the nearest minute, for 140 runners to complete a fun run - Edexcel - A-Level Maths Statistics - Question 3 - 2008 - Paper 1
Step 1
Identify the relevant bars for the range 78.5 to 90.5 minutes

Answer
In the histogram, identify the bars that encompass the interval from 78.5 to 90.5 minutes. This is done by examining the range and finding that it covers the widths between:
- 78.5 to 80.5 (includes the bar centered at 79 minutes)
- 80.5 to 82.5 (includes the bar centered at 81 minutes)
- 82.5 to 84.5 (includes the bar centered at 83 minutes)
- 84.5 to 86.5 (includes the bar centered at 85 minutes)
- 86.5 to 88.5 (includes the bar centered at 87 minutes)
- 88.5 to 90.5 (includes the bar centered at 89 minutes)
Step 2
Calculate the approximate frequency for each relevant bar
Answer
Using the histogram:
- For the bar between 78.5 and 80.5 minutes, the height is 7 (frequency density).
- For the bar between 80.5 and 82.5 minutes, the height is 4.
- For the bar between 82.5 and 84.5 minutes, the height is 2.
- For the bar between 84.5 and 86.5 minutes, the height is 5.
- For the bar between 86.5 and 88.5 minutes, the height is 3.
- For the bar between 88.5 and 90.5 minutes, the height is 1.
Step 3
Find the total frequency and the number of runners
Answer
To find the number of runners in this range, calculate the areas of the relevant bars:
- Bar from 78.5 to 80.5: Area = height x width = 7 x 2 = 14
- Bar from 80.5 to 82.5: Area = 4 x 2 = 8
- Bar from 82.5 to 84.5: Area = 2 x 2 = 4
- Bar from 84.5 to 86.5: Area = 5 x 2 = 10
- Bar from 86.5 to 88.5: Area = 3 x 2 = 6
- Bar from 88.5 to 90.5: Area = 1 x 2 = 2
Next, sum these areas: 14 + 8 + 4 + 10 + 6 + 2 = 44. Finally, since the total number of runners is 140, we can calculate the proportion of runners in this range and conclude that the number of runners who took between 78.5 and 90.5 minutes is 12.