Photo AI
A scientist is researching whether or not birds of prey exposed to pollutants lay eggs with thinner shells - Edexcel - A-Level Maths Statistics - Question 3 - 2012 - Paper 2
Question 3
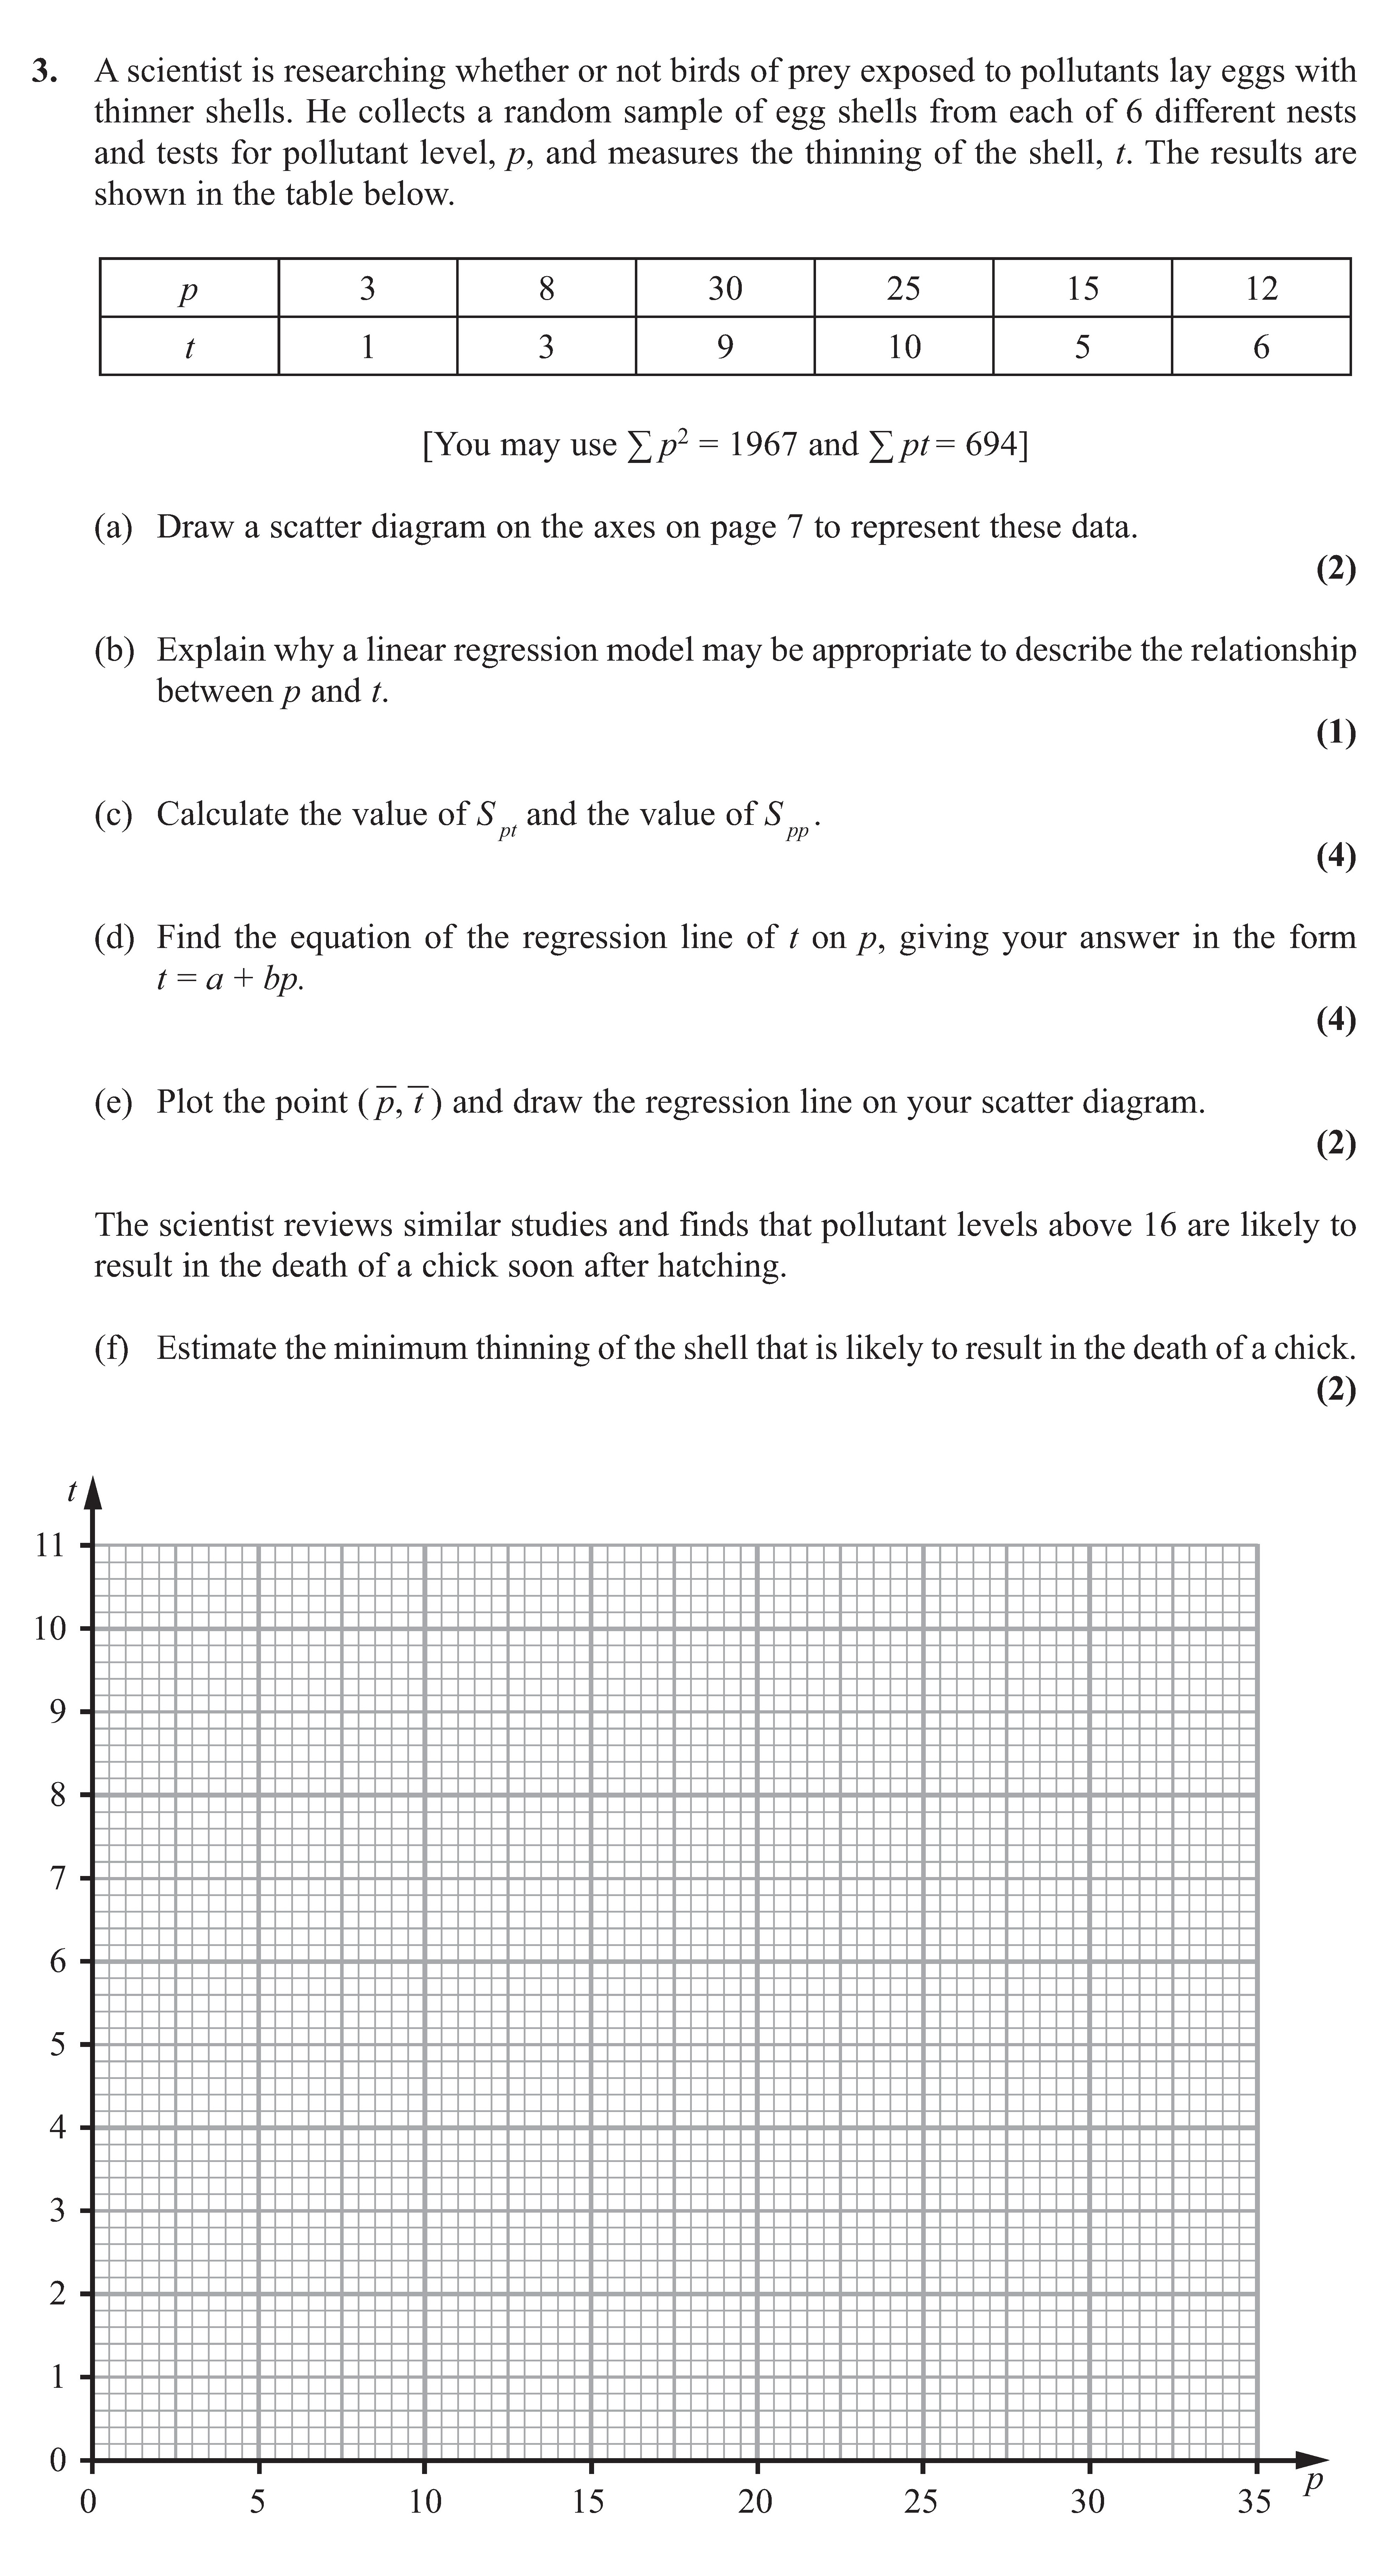
A scientist is researching whether or not birds of prey exposed to pollutants lay eggs with thinner shells. He collects a random sample of egg shells from each of 6 ... show full transcript
Worked Solution & Example Answer:A scientist is researching whether or not birds of prey exposed to pollutants lay eggs with thinner shells - Edexcel - A-Level Maths Statistics - Question 3 - 2012 - Paper 2
Step 1
Draw a scatter diagram on the axes on page 7 to represent these data.

Answer
To draw the scatter diagram, plot the points corresponding to the values of ( p ) (pollutant level) on the x-axis and ( t ) (thinning of the shell) on the y-axis. Each point represents a nest, providing a visual representation of the relationship between the two variables.
Step 2
Explain why a linear regression model may be appropriate to describe the relationship between \( p \) and \( t \).
Answer
A linear regression model may be appropriate if the plotted points in the scatter diagram show a linear trend, indicating a consistent increase or decrease in ( t ) with respect to ( p ). If there is a strong correlation between the variables, as indicated by the proximity of points to a line, a linear model is justified.
Step 3
Step 4
Find the equation of the regression line of \( t \) on \( p \), giving your answer in the form \( t = a + bp \).
Answer
The regression line equation can be formulated using the least squares method. We compute the slope ( b ) and intercept ( a ):
[ b = \frac{S_{p \cdot t} - \frac{S_p S_t}{n}}{S_{p^2} - \frac{S_p^2}{n}} \approx 0.318 ] (using previously calculated values)
Then, calculate ( a = \bar{t} - b \bar{p} ). The final form is obtained such as:
[ t = 0.741 + 0.318p ]
Step 5
Plot the point \( \bar{p}, \bar{t} \) and draw the regression line on your scatter diagram.
Answer
Calculate ( \bar{p} ) and ( \bar{t} ), and plot this point on the scatter diagram. Draw the regression line using the equation obtained in the previous step. Ensure that the line extends through the axes properly reflecting the regression relationship.
Step 6
Estimate the minimum thinning of the shell that is likely to result in the death of a chick soon after hatching.
Answer
Using the regression equation found earlier, evaluate the thinning value ( t ) for pollutant levels just above 16:
[\text{For } p > 16, \text{ find } t = 0.741 + 0.318 \cdot 16 \approx 5.8 ]\nThus, a thinning of approximately ( 5.8 ) is estimated to likely result in the death of a chick.