Charlie is studying the time it takes members of his company to travel to the office - Edexcel - A-Level Maths Statistics - Question 4 - 2018 - Paper 2
Question 4
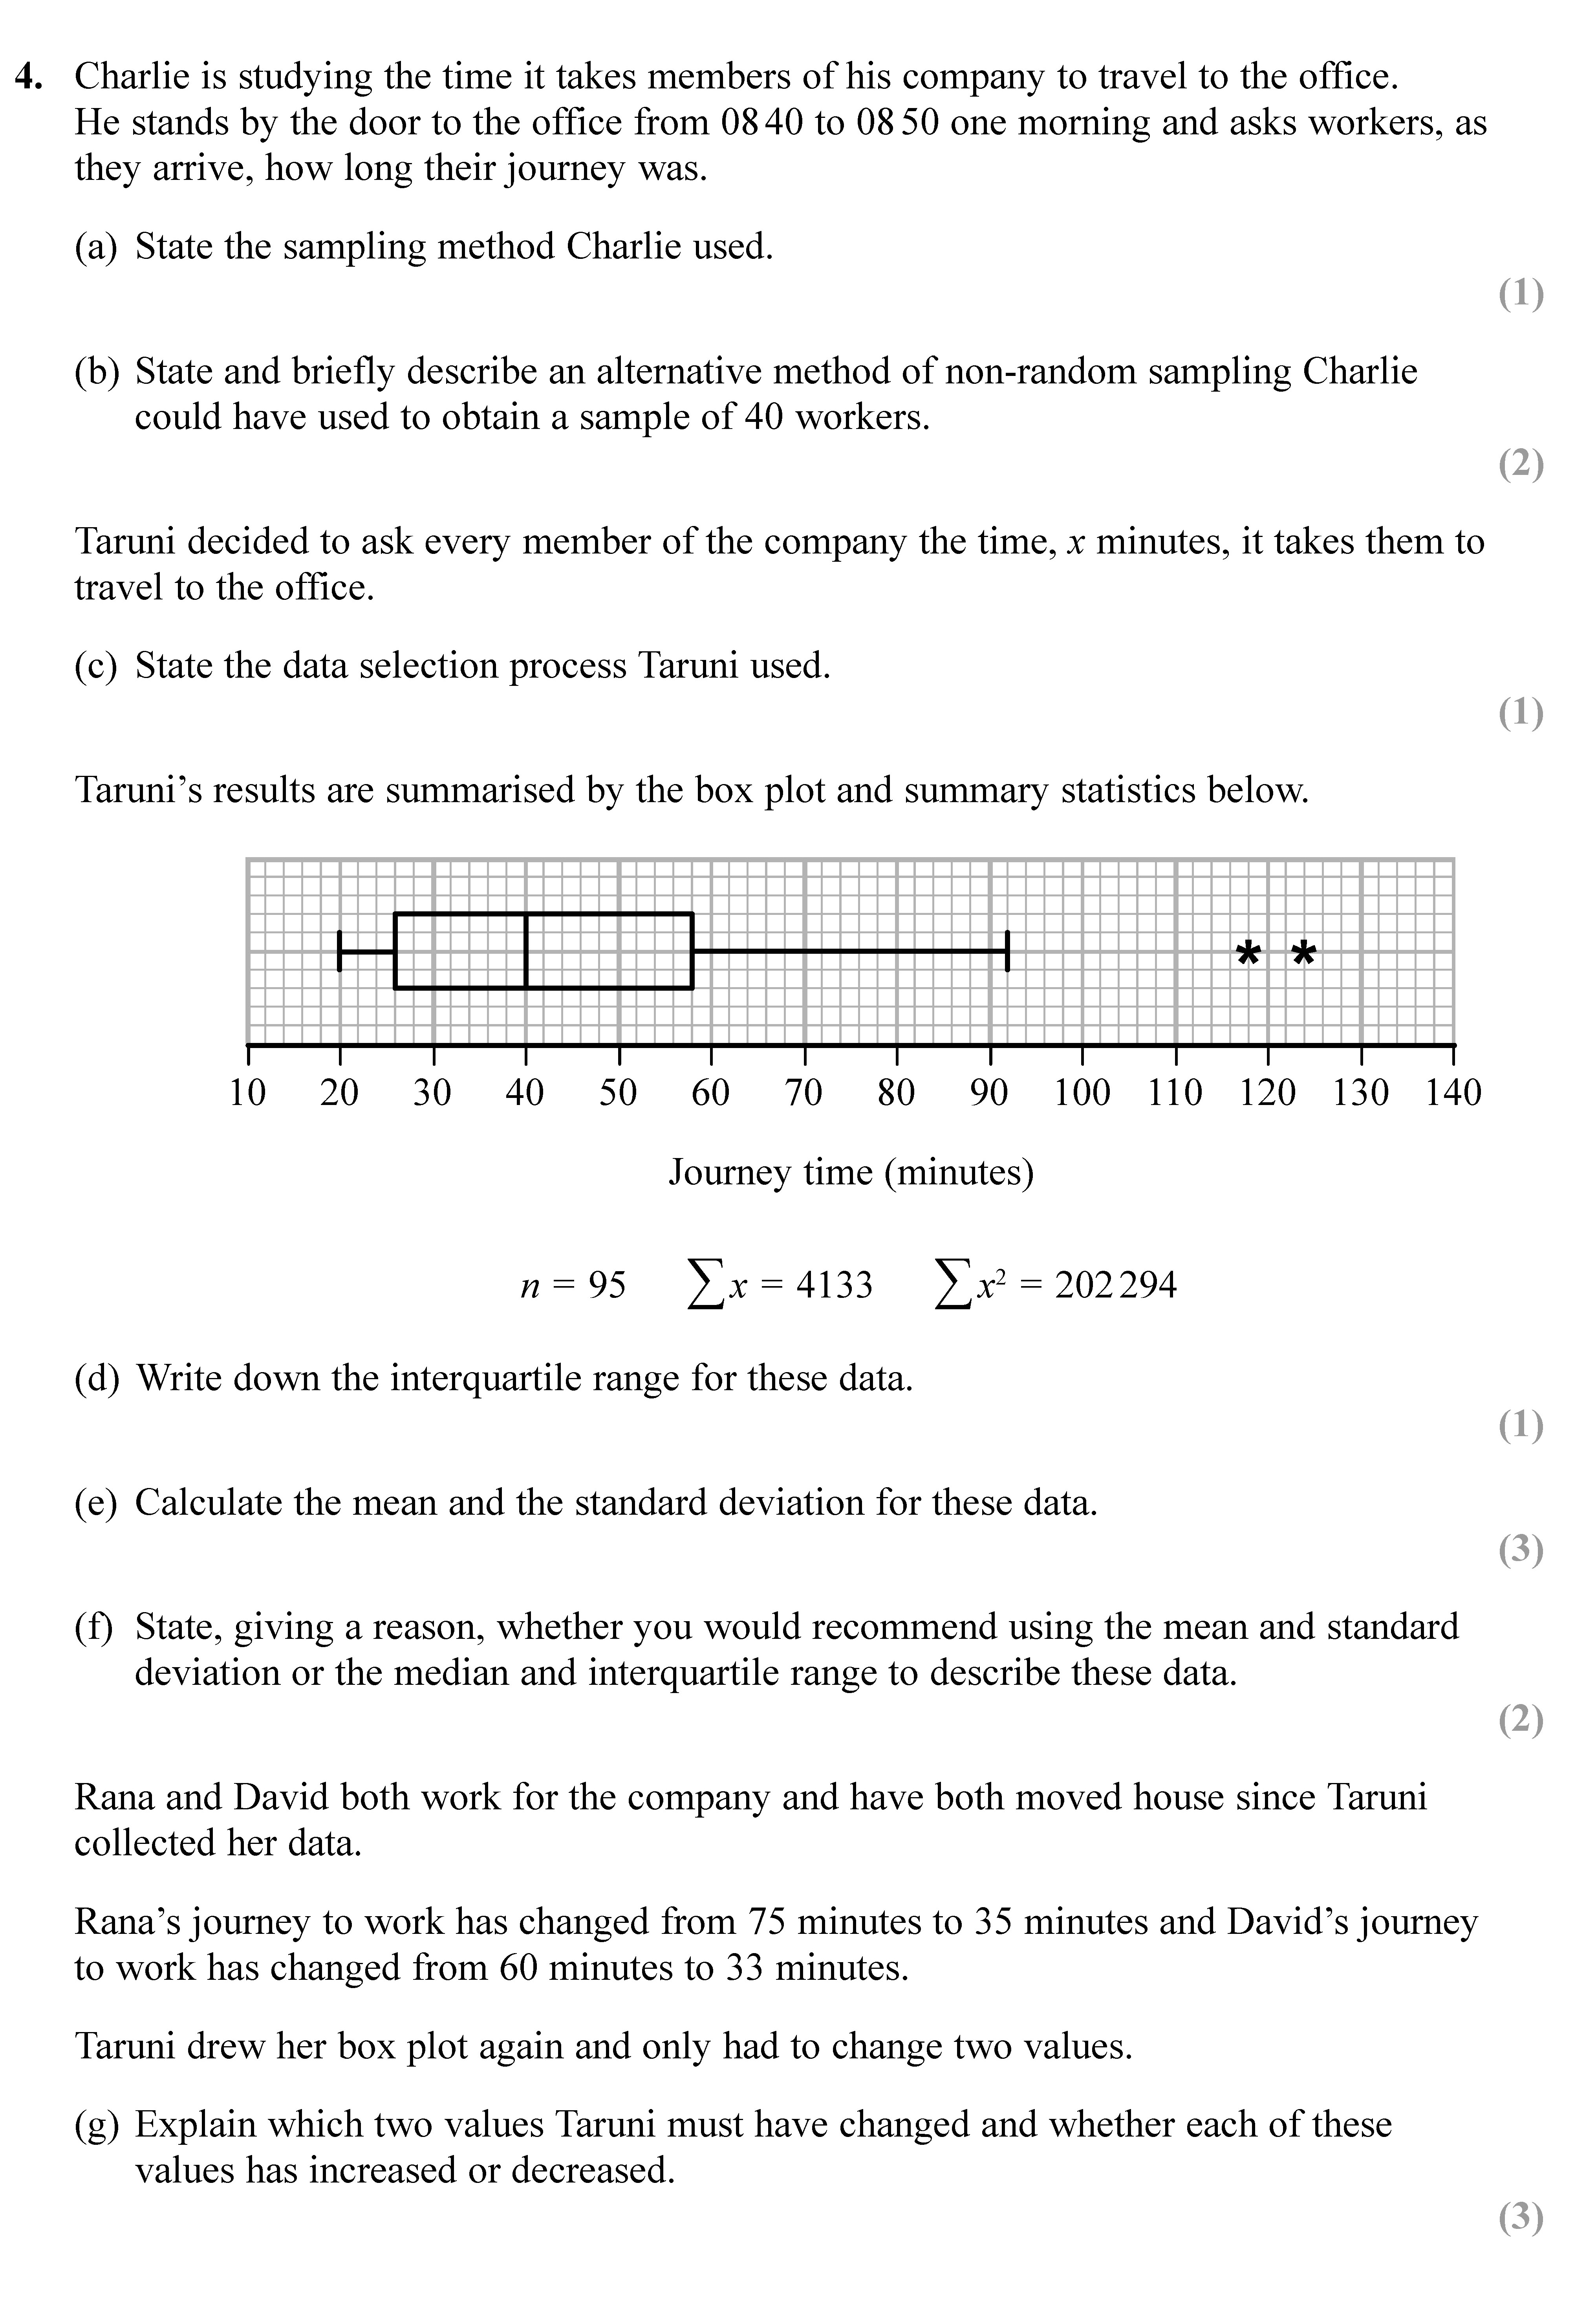
Charlie is studying the time it takes members of his company to travel to the office. He stands by the door to the office from 08:40 to 08:50 one morning and asks wo... show full transcript
Worked Solution & Example Answer:Charlie is studying the time it takes members of his company to travel to the office - Edexcel - A-Level Maths Statistics - Question 4 - 2018 - Paper 2
Step 1
State the sampling method Charlie used.
96%
114 rated
Only available for registered users.
Sign up now to view full answer, or log in if you already have an account!
Answer
The sampling method used by Charlie is convenience sampling, as he sampled workers based on their arrival at the office.
Step 2
State and briefly describe an alternative method of non-random sampling Charlie could have used to obtain a sample of 40 workers.
99%
104 rated
Only available for registered users.
Sign up now to view full answer, or log in if you already have an account!
Answer
An alternative method that Charlie could have used is quota sampling. This method involves selecting specific groups to ensure that the sample reflects certain characteristics, such as different departments or job roles. Charlie could approach a predetermined number of workers from each group until a total of 40 is reached.
Step 3
State the data selection process Taruni used.
96%
101 rated
Only available for registered users.
Sign up now to view full answer, or log in if you already have an account!
Answer
Taruni used a systematic sampling method by asking every member of the company for their travel time to the office, ensuring that every individual was given an equal opportunity to provide their data.
Step 4
Write down the interquartile range for these data.
98%
120 rated
Only available for registered users.
Sign up now to view full answer, or log in if you already have an account!
Answer
The interquartile range (IQR) can be calculated as follows: IQR = Q3 - Q1. From the box plot, Q1 is at 26 minutes and Q3 is at 58 minutes, therefore:
extIQR=58−26=32extminutes
Step 5
Calculate the mean and the standard deviation for these data.
97%
117 rated
Only available for registered users.
Sign up now to view full answer, or log in if you already have an account!
State, giving a reason, whether you would recommend using the mean and standard deviation or the median and interquartile range to describe these data.
97%
121 rated
Only available for registered users.
Sign up now to view full answer, or log in if you already have an account!
Answer
I would recommend using the median and interquartile range (IQR) because there are outliers in the data. The presence of outliers can skew the mean and inflate the standard deviation, making them less representative of the typical journey times.
Step 7
Explain which two values Taruni must have changed and whether each of these values has increased or decreased.
96%
114 rated
Only available for registered users.
Sign up now to view full answer, or log in if you already have an account!
Answer
Taruni must have changed the maximum journey time from 75 minutes to 35 minutes, and the second high value from 60 minutes to 33 minutes. Both values have decreased.