Photo AI
A survey of 100 households gave the following results for weekly income $y$ - Edexcel - A-Level Maths Statistics - Question 5 - 2013 - Paper 1
Question 5
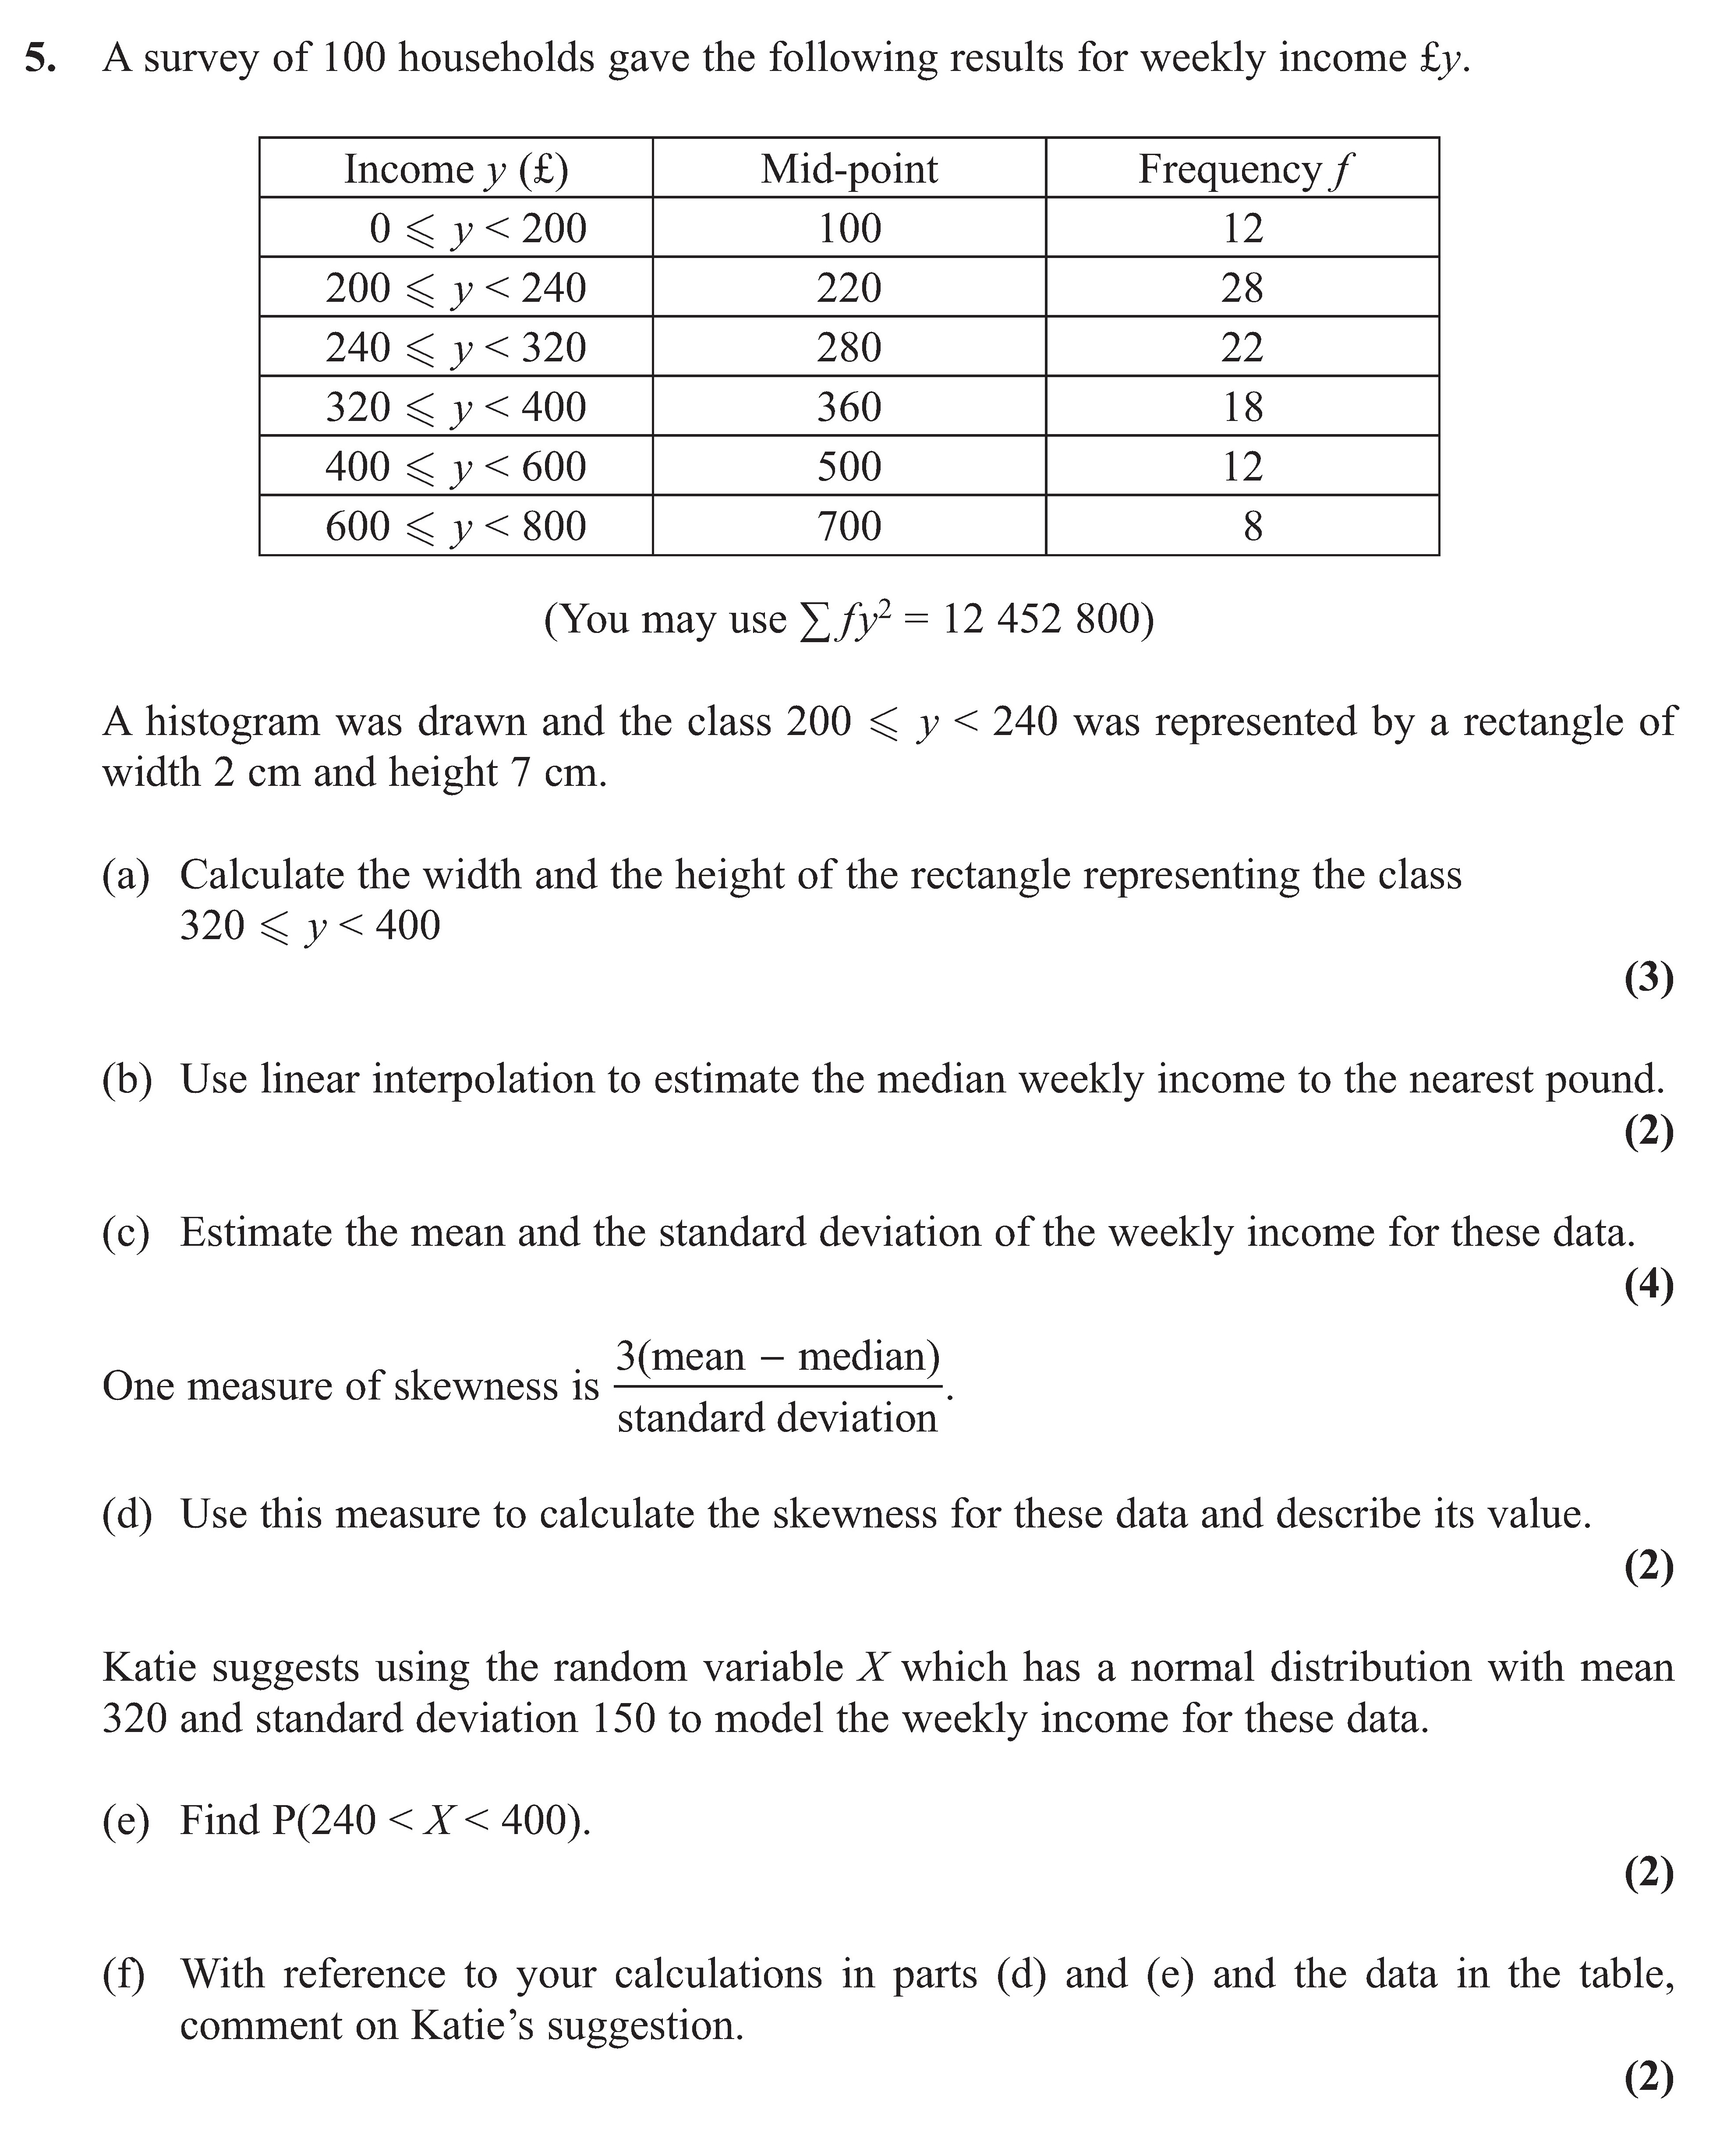
A survey of 100 households gave the following results for weekly income $y$. Income $y$ (£) 0 $\leq y < 200$ 200 $\leq y < 240$ 240 $\leq y < 320$ 320 $\leq... show full transcript
Worked Solution & Example Answer:A survey of 100 households gave the following results for weekly income $y$ - Edexcel - A-Level Maths Statistics - Question 5 - 2013 - Paper 1
Step 1
Calculate the width and the height of the rectangle representing the class 320 $\leq y < 400$.

Answer
The width of the class 320 can be calculated as follows:
Width = Upper limit - Lower limit = 400 - 320 = 80.
To determine the height, we note that the frequency for this class is 18. The height can be found using the area of the histogram's rectangle:
Area = Width * Height.
We also know that 4 cm represents a frequency of 28, thus:
Height = \frac{\text{Frequency}}{\text{Width}}
Let's calculate the height:
Height = \frac{18}{80} * \frac{4}{28} = \frac{72}{28} = 2.25.
Thus, the width is 80 cm and the height is 2.25 cm.
Step 2
Use linear interpolation to estimate the median weekly income to the nearest pound.
Answer
To find the median, we first locate the cumulative frequency that corresponds to the 50th value. There are 100 households, so the 50th value corresponds to the median position.
Calculating the cumulative frequency:
- Class 0-200: 12
- Class 200-240: 20 (12 + 8)
- Class 240-320: 42 (20 + 22)
- Class 320-400: 60 (42 + 18)
The median class is 320 to 400.
Using linear interpolation, we find:
Median estimate = L + \left(\frac{\frac{N}{2} - CF}{f}\right) \times c
Where:
- L = lower boundary of the median class = 320
- N = total frequency = 100
- CF = cumulative frequency before the median class = 42
- f = frequency of the median class = 18
- c = class interval width = 80
Therefore:
Median estimate = 320 + \left(\frac{50 - 42}{18}\right) \times 80 = 320 + \left(\frac{8}{18}\right) \times 80
Calculating: = 320 + 35.56 \approx 355.56, rounded to the nearest pound is 356.
Step 3
Estimate the mean and the standard deviation of the weekly income for these data.
Answer
To calculate the mean, use:
Mean = \frac{\sum (f \cdot m)}{N} Where:
- = frequency,
- = mid-point of each class,
- = total frequency = 100.
Calculating:
[ ext{Mean} = \frac{(100 \cdot 100) + (220 \cdot 8) + (280 \cdot 22) + (360 \cdot 18) + (500 \cdot 12) + (700 \cdot 8)}{100} = \frac{31600}{100} = 316.
]
Next, for standard deviation:
[ \sigma = \sqrt{\frac{\sum (f \cdot (m - \text{mean})^2)}{N}}
]
Calculating for standard deviation:
[ \sum f m^2 = 12 ; 452 ; 800 \text{ (given)}
]
Then:
[ \sigma^2 = (\frac{12 ; 452 ; 800}{100}) - (316)^2 = 124528 - 99856 = 24672. \text{ Therefore,}\sigma \approx 157. \n]
Step 4
Use this measure to calculate the skewness for these data and describe its value.
Answer
Skewness is measured as:
[ ext{Skewness} = \frac{3(\text{Mean} - \text{Median})}{\text{Standard Deviation}}
]
Substituting the values:
- Mean = 316, Median = 356, Standard Deviation = 157.
Calculating: [ ext{Skewness} = \frac{3(316 - 356)}{157} = \frac{3(-40)}{157} = -0.764. ]
This indicates a negative skew, which means the data is left-tailed.
Step 5
Find $P(240 < X < 400)$.
Answer
Using the normal distribution, we convert the values using the Z-score formula:
[ Z = \frac{X - \mu}{\sigma}
]
Where:
- , .
Calculating for lower value (240): [ Z_{240} = \frac{240 - 320}{150} = -0.53. ]
Calculating for upper value (400): [ Z_{400} = \frac{400 - 320}{150} = 0.53. ]
Using the standard normal distribution table:
- $P(Z < -0.53) \approx 0.298 \
- P(Z < 0.53) \approx 0.703.
] Thus: [ P(240 < X < 400) = P(Z < 0.53) - P(Z < -0.53) = 0.703 - 0.298 = 0.405. ]
Step 6
With reference to your calculations in parts (d) and (e) and the data in the table, comment on Katie's suggestion.
Answer
The skewness calculated in part (d) is negative, indicating that the distribution of income is left-tailed. Katie's suggestion to model the weekly income using a normal distribution centered at 320 and with a standard deviation of 150 does not fully capture the actual income distribution, which is skewed. Moreover, the probability calculated in part (e) shows that there is around a 40% chance of incomes being between 240 and 400, which aligns with the negative skew observed previously. The normal assumption may not hold, hence her suggestion could misrepresent the real-life distributions seen in the data.