Photo AI
A teacher asked a random sample of 10 students to record the number of hours of television, $t$, they watched in the week before their mock exam - Edexcel - A-Level Maths Statistics - Question 1 - 2013 - Paper 1
Question 1
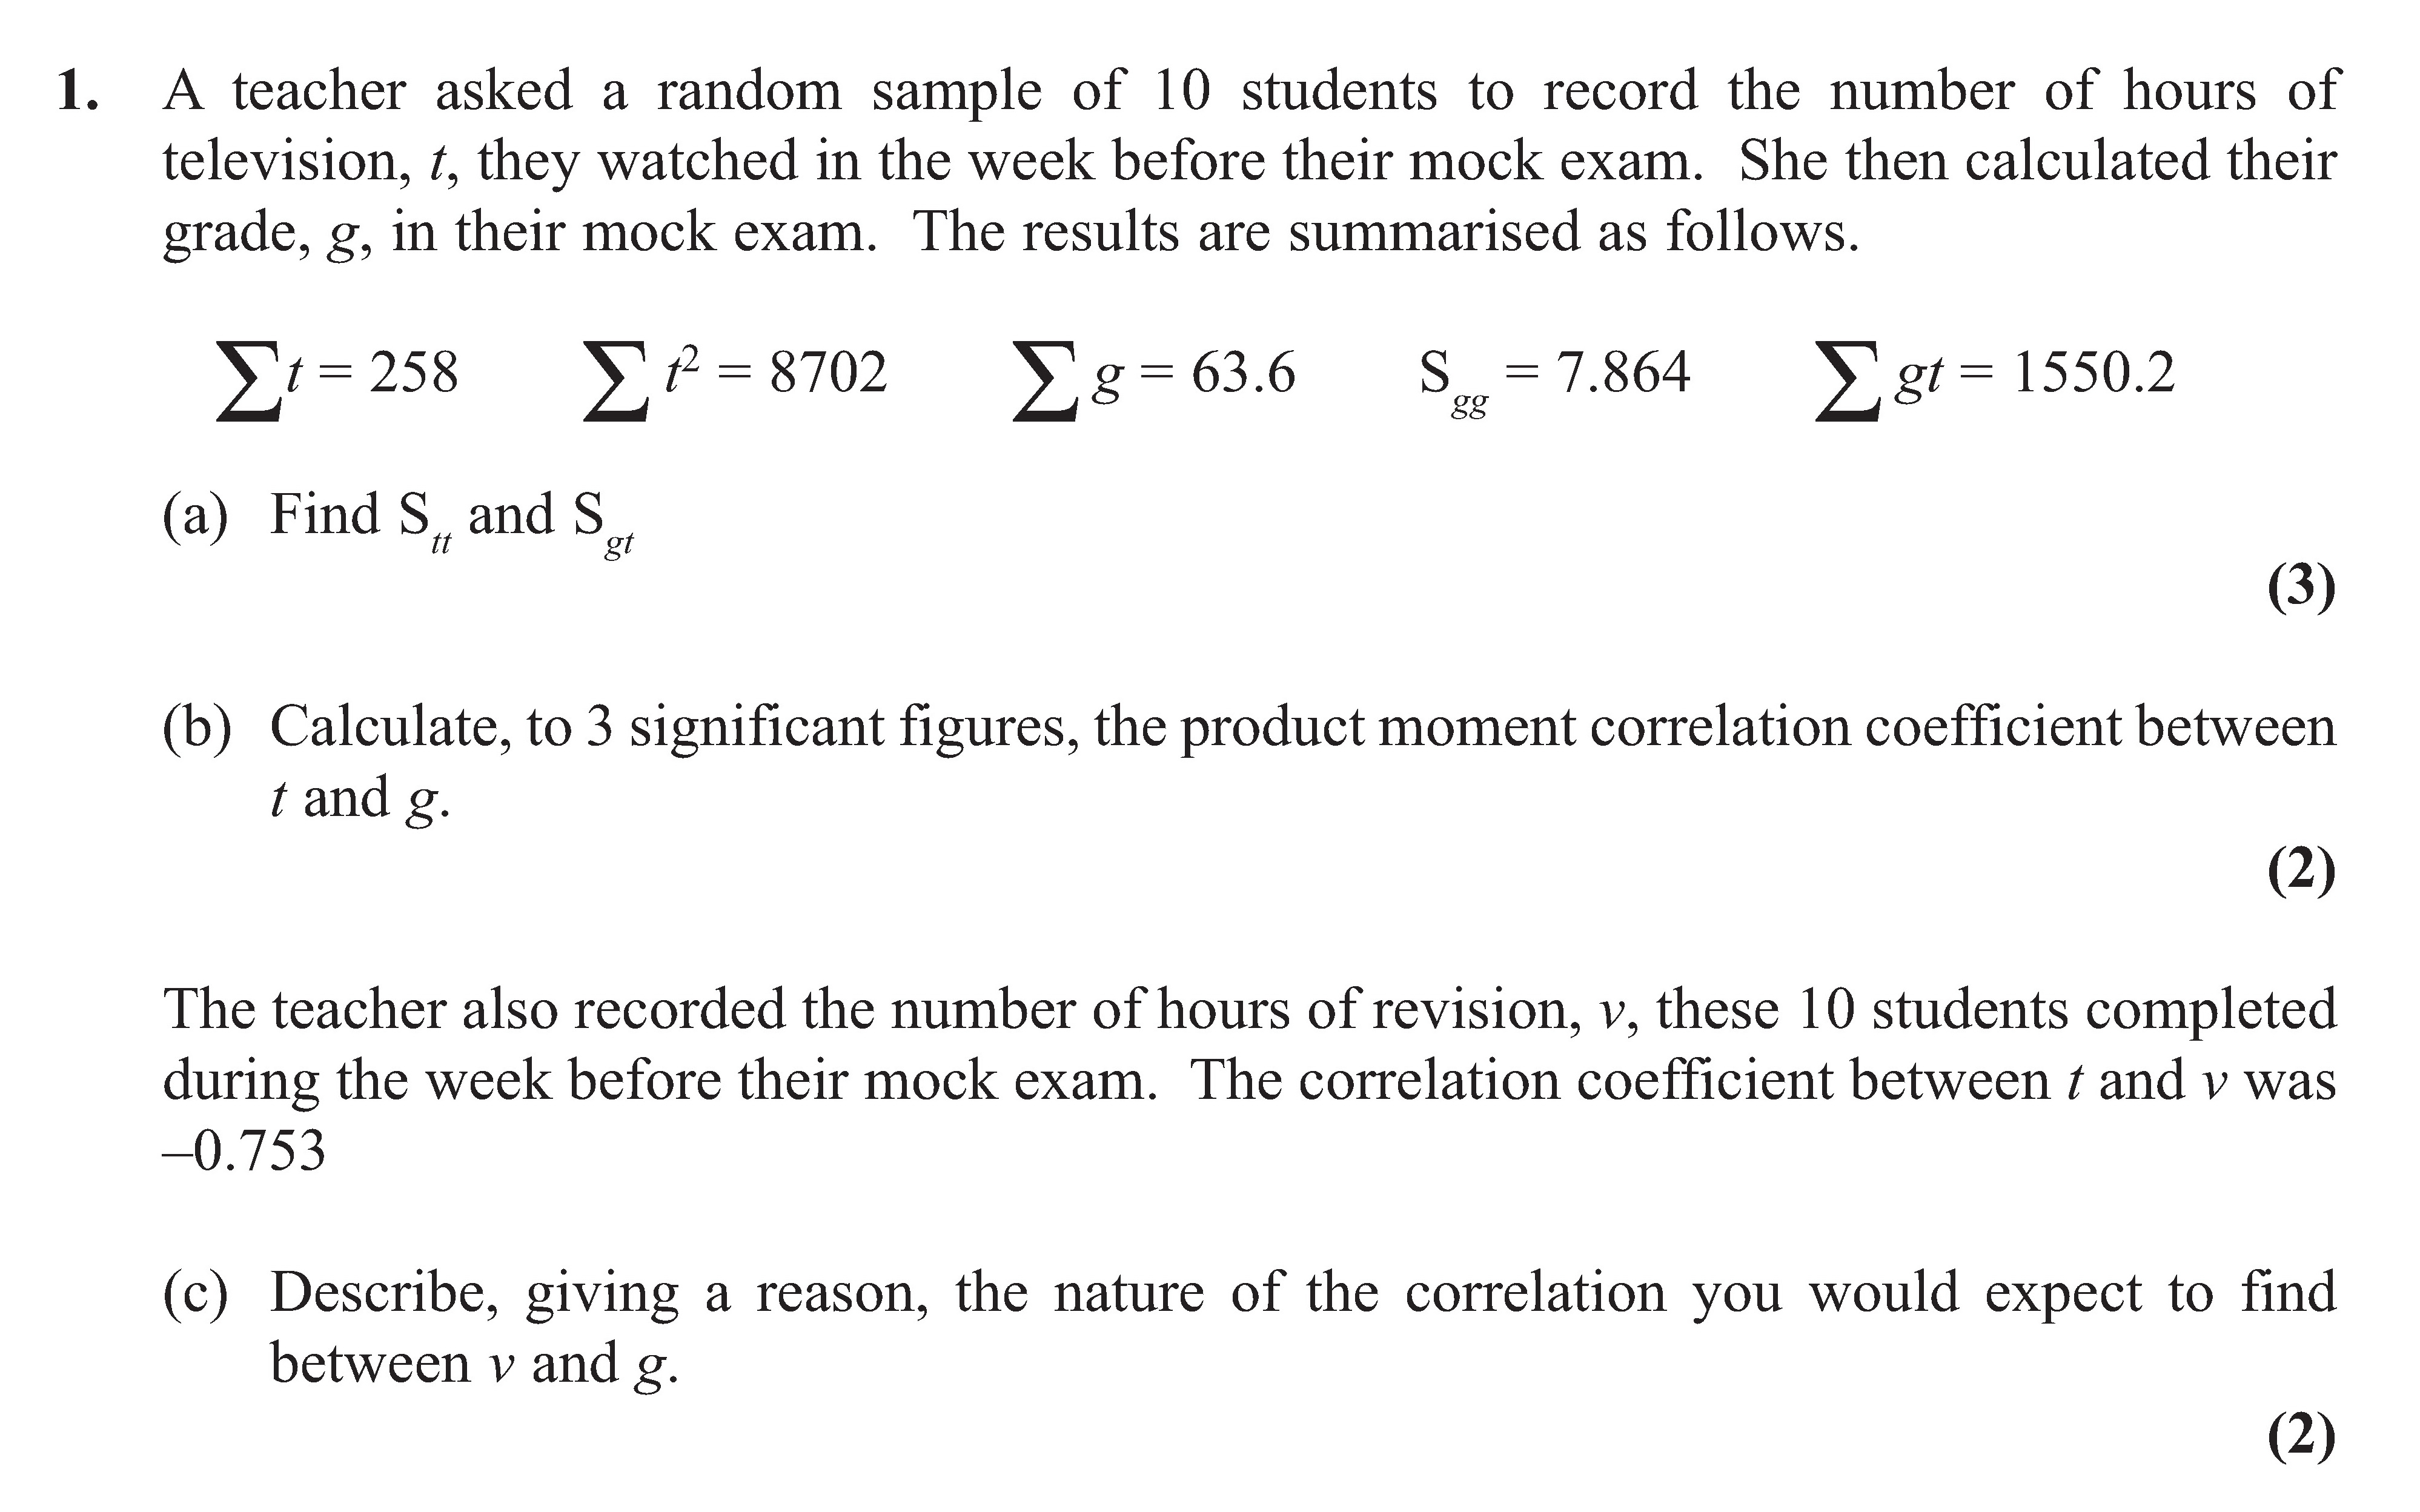
A teacher asked a random sample of 10 students to record the number of hours of television, $t$, they watched in the week before their mock exam. She then calculated... show full transcript
Worked Solution & Example Answer:A teacher asked a random sample of 10 students to record the number of hours of television, $t$, they watched in the week before their mock exam - Edexcel - A-Level Maths Statistics - Question 1 - 2013 - Paper 1
Step 1

Step 2
Calculate, to 3 significant figures, the product moment correlation coefficient between $t$ and $g$.
Answer
The product moment correlation coefficient is calculated using the formula:
Substituting the known values we have:
After performing the calculations, we arrive at:
Thus, the correlation coefficient to three significant figures is:
Answer:
Step 3
Describe, giving a reason, the nature of the correlation you would expect to find between $v$ and $g$.
Answer
The correlation between (hours of revision) and (grade) is expected to be positive. This is because as the number of hours spent revising increases, students are likely to perform better in their exams. Thus, there is a direct relationship where higher revision time corresponds to higher grades.