Photo AI
A policeman records the speed of the traffic on a busy road with a 30 mph speed limit - Edexcel - A-Level Maths Statistics - Question 5 - 2012 - Paper 2
Question 5
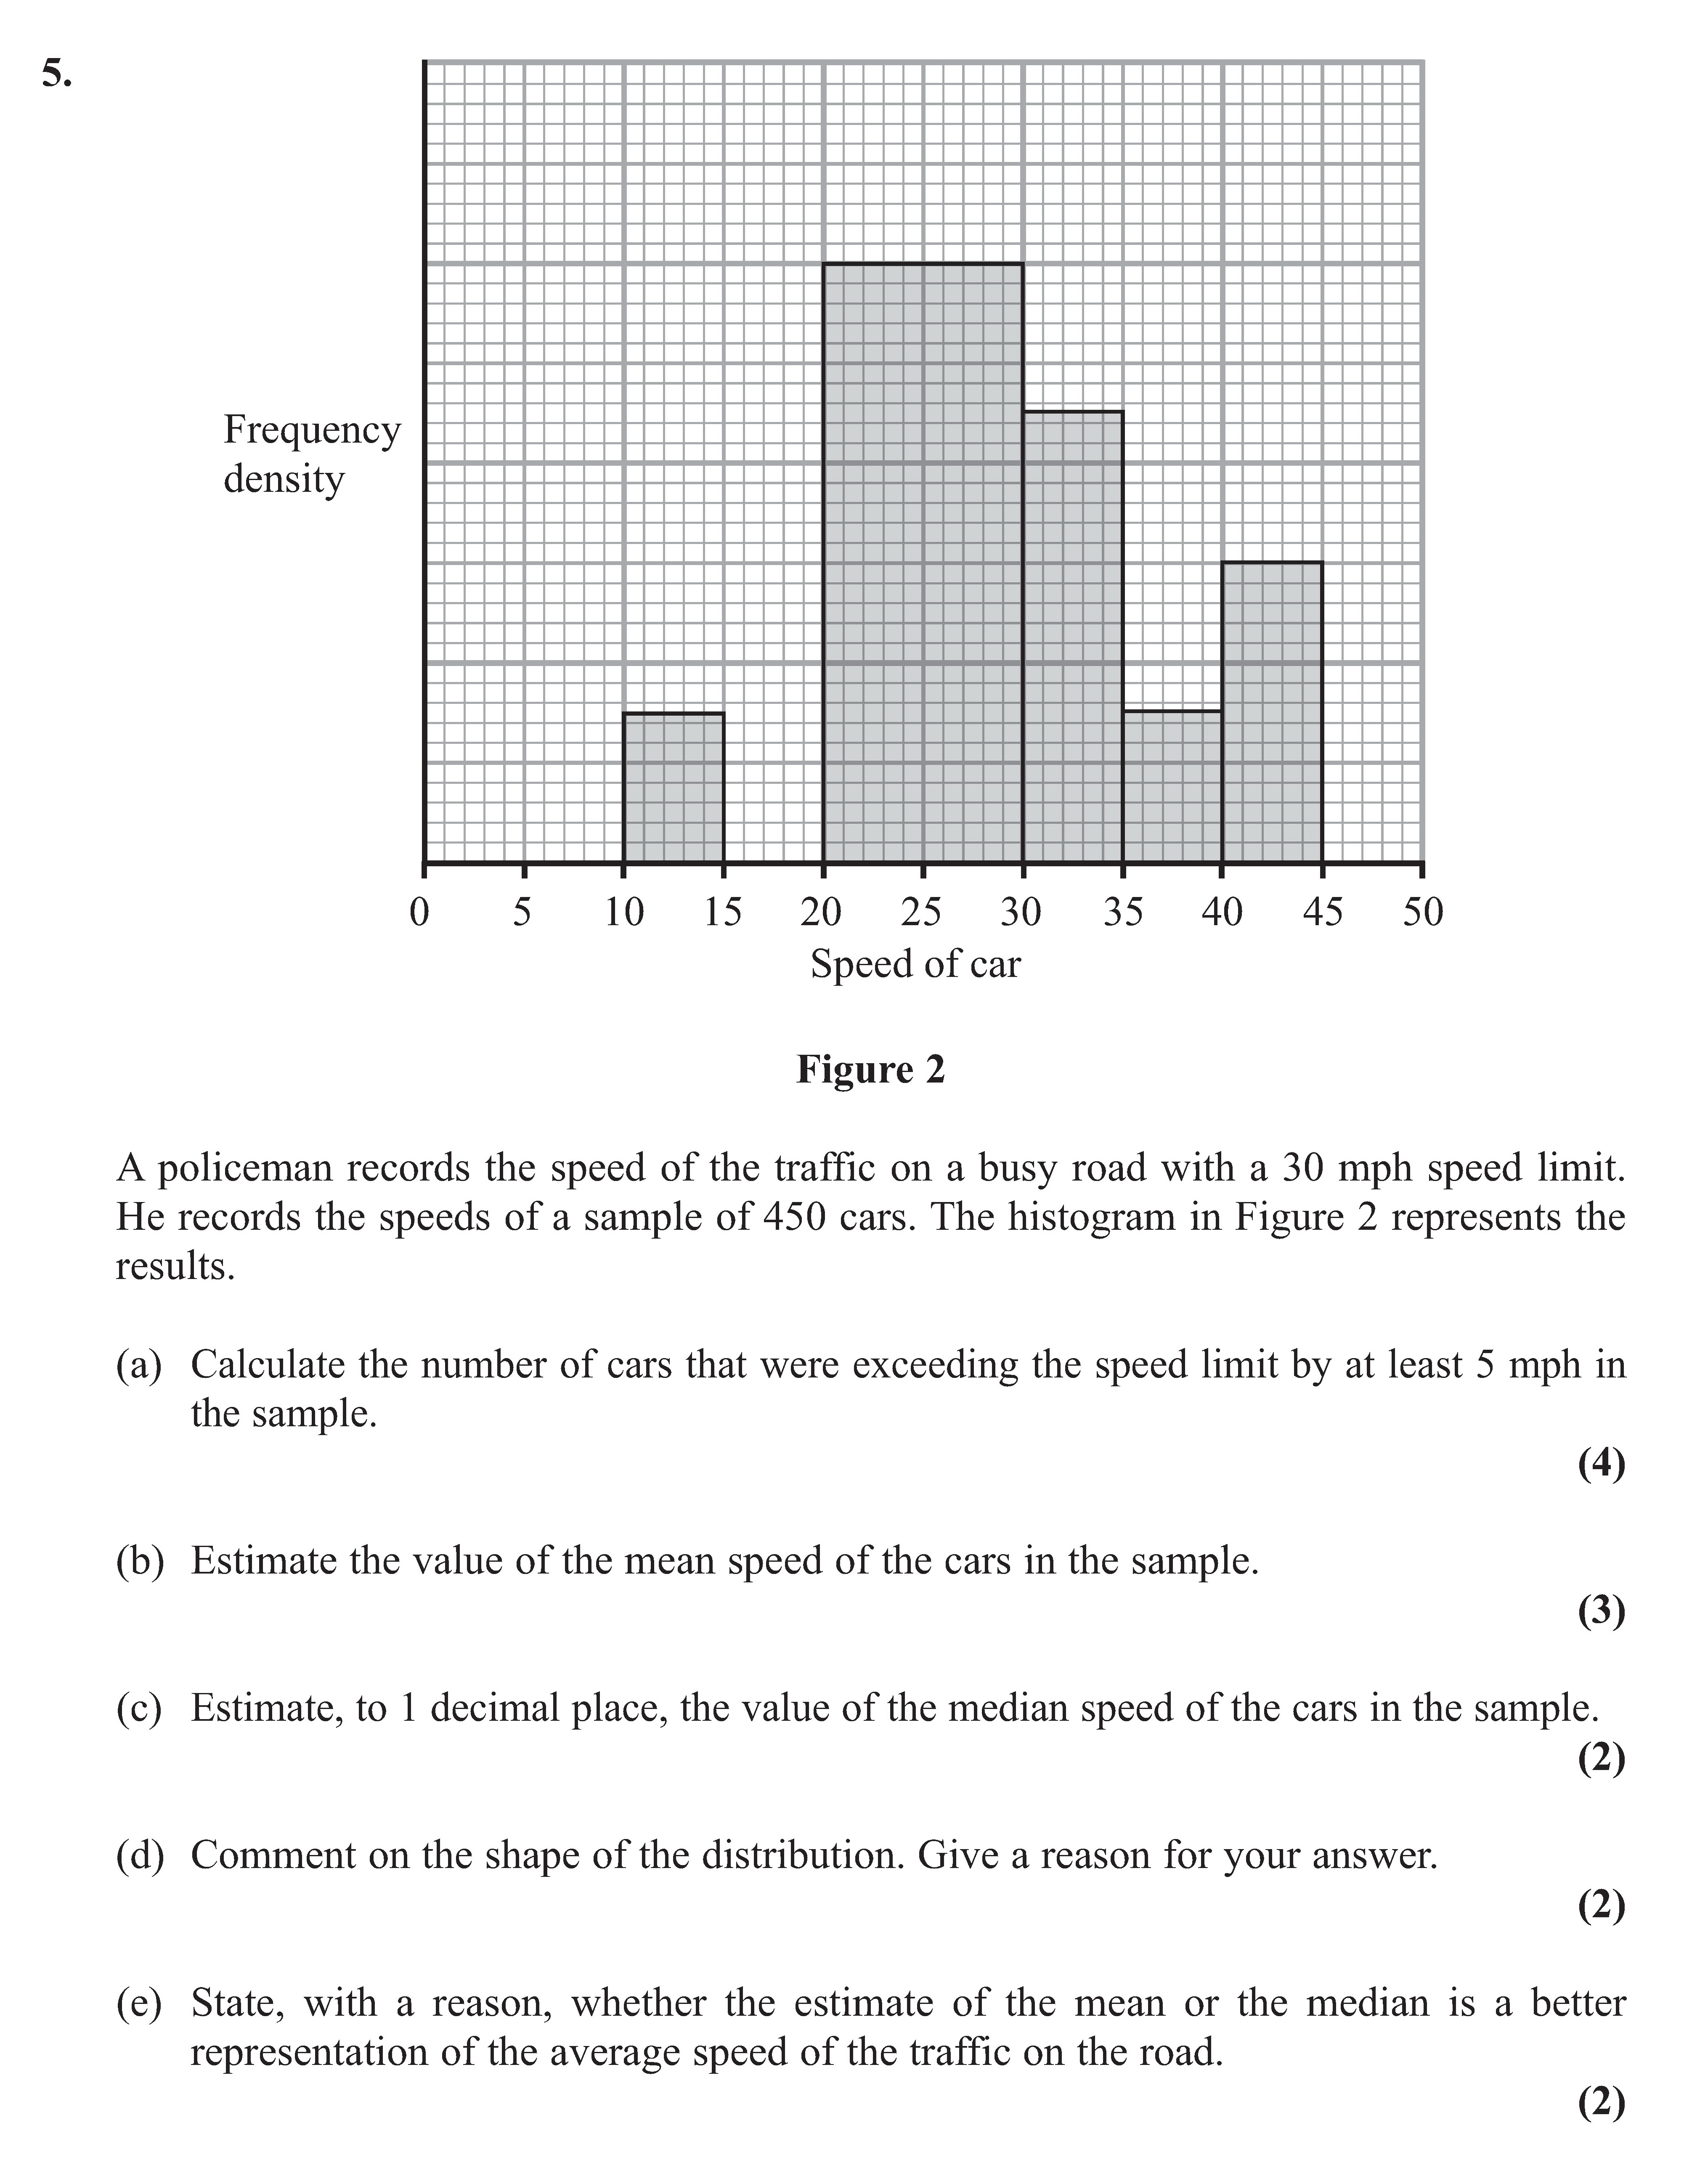
A policeman records the speed of the traffic on a busy road with a 30 mph speed limit. He records the speeds of a sample of 450 cars. The histogram in Figure 2 repre... show full transcript
Worked Solution & Example Answer:A policeman records the speed of the traffic on a busy road with a 30 mph speed limit - Edexcel - A-Level Maths Statistics - Question 5 - 2012 - Paper 2
Step 1
Calculate the number of cars that were exceeding the speed limit by at least 5 mph in the sample.

Answer
To find the number of cars exceeding the 35 mph speed limit (30 mph + 5 mph), we analyze the histogram. The heights of the bars represent frequency density. First, we calculate the area of the relevant bars:
- The bar from 35 mph to 40 mph has a height of 0.1, and the width is 5, giving an area of:
- The area from 40 mph to 50 mph has a height of 0.06 and a width of 10, giving an area of:
The total area for cars exceeding 35 mph is:
Multiply this area by the total number of cars (450): cars exceeding the speed limit.
Step 2
Estimate the value of the mean speed of the cars in the sample.
Answer
To estimate the mean speed, we use mid-points of the interval classes from the histogram:
-
Calculate the mid-point for each class interval and their respective frequencies (areas):
- For the range [0-5], midpoint = 2.5, frequency (area) = 0.25
- For [5-10], midpoint = 7.5, frequency = 0.6
- For [10-15], midpoint = 12.5, frequency = 0.12
- For [15-20], midpoint = 17.5, frequency = 0.15
- For [20-25], midpoint = 22.5, frequency = 0.3
- For [25-30], midpoint = 27.5, frequency = 0.33
- For [30-35], midpoint = 32.5, frequency = 0.25
- For [35-40], midpoint = 37.5, frequency = 0.15
- For [40-45], midpoint = 42.5, frequency = 0.06
- For [45-50], midpoint = 47.5, frequency = 0.04
-
Calculate the mean using: Using calculated values, we arrive at:
Step 3
Estimate, to 1 decimal place, the value of the median speed of the cars in the sample.
Answer
To find the median, we consider the cumulative frequency distribution:
-
With 450 total cars, the median position is at:
-
We add the frequencies:
-
The 225th car falls in the 20-25 range, hence the estimated median is: (to 1 decimal place).
Step 4
Comment on the shape of the distribution. Give a reason for your answer.
Answer
Upon reviewing the histogram, the distribution appears positively skewed. This is determined by observing that:
- The left tail of the histogram is longer than the right.
- Most of the data falls to the left of the peak, with fewer drivers recorded at higher speeds. This indicates the presence of outliers or extreme values at the higher end, affecting the overall shape.
Step 5
State, with a reason, whether the estimate of the mean or the median is a better representation of the average speed of the traffic on the road.
Answer
Given the positively skewed distribution, the median is a more robust measure of central tendency for this dataset. The median isn’t affected by extreme values, which may inflate the mean. Therefore, we can assert that the median provides a better representation of the average speed of traffic.