Photo AI
An estate agent is studying the cost of office space in London - Edexcel - A-Level Maths Statistics - Question 2 - 2017 - Paper 1
Question 2
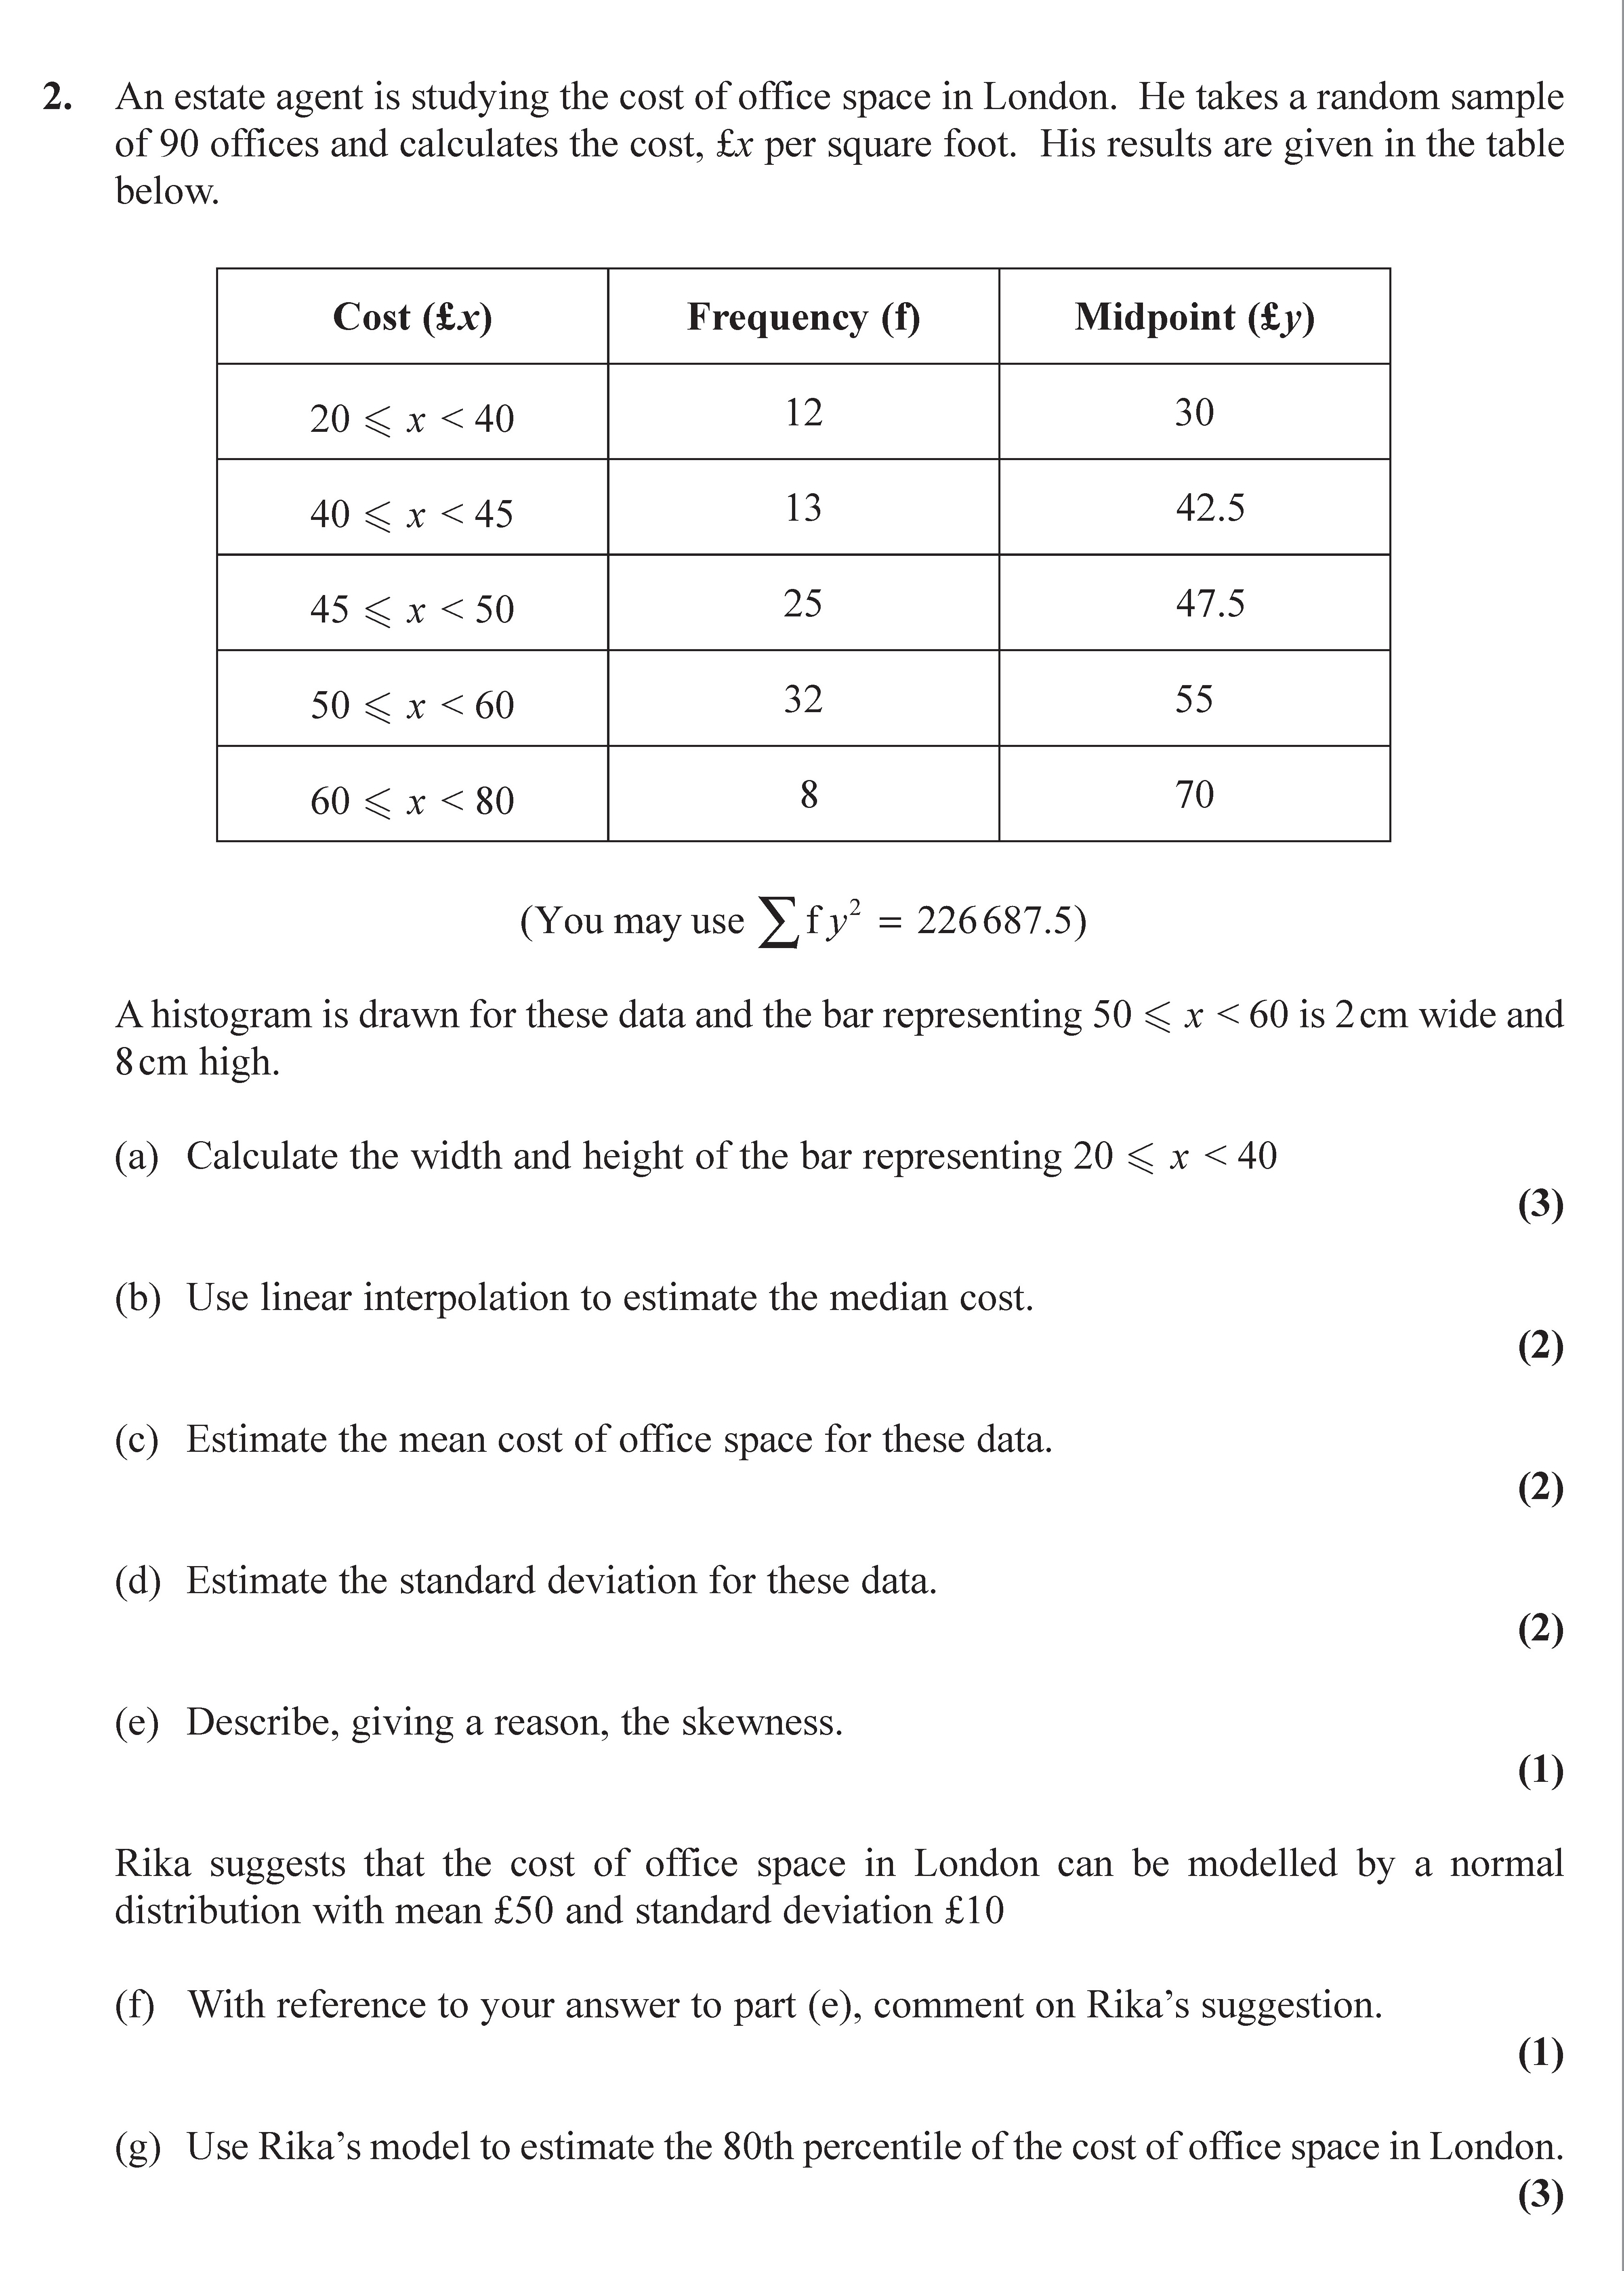
An estate agent is studying the cost of office space in London. He takes a random sample of 90 offices and calculates the cost, £x per square foot. His results are g... show full transcript
Worked Solution & Example Answer:An estate agent is studying the cost of office space in London - Edexcel - A-Level Maths Statistics - Question 2 - 2017 - Paper 1
Step 1
Calculate the width and height of the bar representing 20 ≤ x < 40

Answer
The width of the bar representing 20 ≤ x < 40 is calculated based on the frequency of 12 offices. Each office corresponds to an area represented by the height of the bar in cm.
Given that the bar for 50 ≤ x < 60 is 2 cm wide for 32 offices, we calculate the width for the 20 ≤ x < 40 bar:
[ \text{Width} = \frac{\text{Frequency}}{\text{Height of Bar for 50 ≤ x < 60}} \times 2 = \frac{12}{32} \times 2 = 0.75 \text{ cm} ].
To find the height: The height of a bar representing area is calculated as follows. The total height at 50 ≤ x < 60 is 8 cm. So,
The height for 20 ≤ x < 40 can be calculated:
[ \text{Height} = \frac{12}{\text{Total Area}} \times 8 = \frac{12}{90} \times 8 \approx 1.07 \text{ cm} ].
Step 2
Use linear interpolation to estimate the median cost.
Answer
To estimate the median cost, we find the cumulative frequency (cf) needed to reach the 45th office (which is half of 90). The cumulative frequencies are as follows:
- 0 ≤ x < 40: cf = 12
- 40 ≤ x < 45: cf = 25 (12 + 13)
- 45 ≤ x < 50: cf = 50 (25 + 25)
The median lies in the interval 45 ≤ x < 50. We can use linear interpolation to find the median.
The median is calculated as follows:
[ \text{Median} = L + \left( \frac{\frac{N}{2} - cf}{f} \right) \times c ]
Where:
- L = lower class boundary of the median class = 45
- N = total frequency = 90
- cf = cumulative frequency before the median class = 25
- f = frequency of the median class = 25
- c = class interval = 5
Thus, [ \text{Median} = 45 + \left( \frac{45 - 25}{25} \right) \times 5 = 47.5 ].
Step 3
Estimate the mean cost of office space for these data.
Answer
To estimate the mean cost, we can use the formula for the mean:
[ \text{Mean} = \frac{\sum (f \cdot y)}{N} ]
Where:
- f = frequency
- y = midpoint
- N = total frequency (90)
Computing the summation:
[\sum (f \cdot y) = (12 \cdot 30) + (13 \cdot 42.5) + (25 \cdot 47.5) + (32 \cdot 55) + (8 \cdot 70) = 360 + 552.5 + 1187.5 + 1760 + 560 = 3920 ]
Then, [ \text{Mean} = \frac{3920}{90} \approx 43.56 ].
Step 4
Estimate the standard deviation for these data.
Answer
To estimate the standard deviation, we use the formula:
[\sigma = \sqrt{\frac{\sum f (y - \bar{x})^2}{N}} ]
We first compute the variance:
[\sigma^2 = \frac{\sum f y^2}{N} - \bar{x}^2 ]
Values for ( \sum f y^2 = 226687.5 ):
[ \frac{226687.5}{90} - (\text{Mean})^2 = \frac{226687.5}{90} - (43.56)^2 \approx 6215.28 - 1897.58 \approx 4317.70 ]
Thus, [\sigma \approx \sqrt{4317.7} \approx 65.7 ].
Step 5
Describe, giving a reason, the skewness.
Answer
The data distribution appears to be positively skewed. This is indicated by the mean being greater than the median. When the mean exceeds the median, it suggests the presence of outliers to the right, causing the tail to extend further in that direction. In this dataset, given that the highest costs have a considerable number of offices, we see evidence of more high-valued office spaces.
Step 6
With reference to your answer to part (e), comment on Rika’s suggestion.
Answer
Rika’s suggestion of modeling office costs with a normal distribution may not hold due to the evident positive skewness observed in the data. The assumption of symmetry in a normal distribution is invalid here, as the mean and median diverge significantly. Thus, the data does not satisfy the properties necessary for normal approximation.
Step 7
Use Rika’s model to estimate the 80th percentile of the cost of office space in London.
Answer
To find the 80th percentile using a normal distribution model:
Given: Mean = £50 and standard deviation = £10, we find the z-score for the 80th percentile using standard normal distribution tables:
[ z \approx 0.8416 ]
Then, applying the z-score to estimate the 80th percentile: [ P_{80} = \mu + z \sigma = 50 + (0.8416 \times 10) \approx 58.42 ].
Thus, the 80th percentile of the cost of office space is approximately £58.42.