Photo AI
Past records show that the times, in seconds, taken to run 100 m by children at a school can be modelled by a normal distribution with a mean of 16.12 and a standard deviation of 1.60 A child from the school is selected at random - Edexcel - A-Level Maths Statistics - Question 4 - 2011 - Paper 2
Question 4
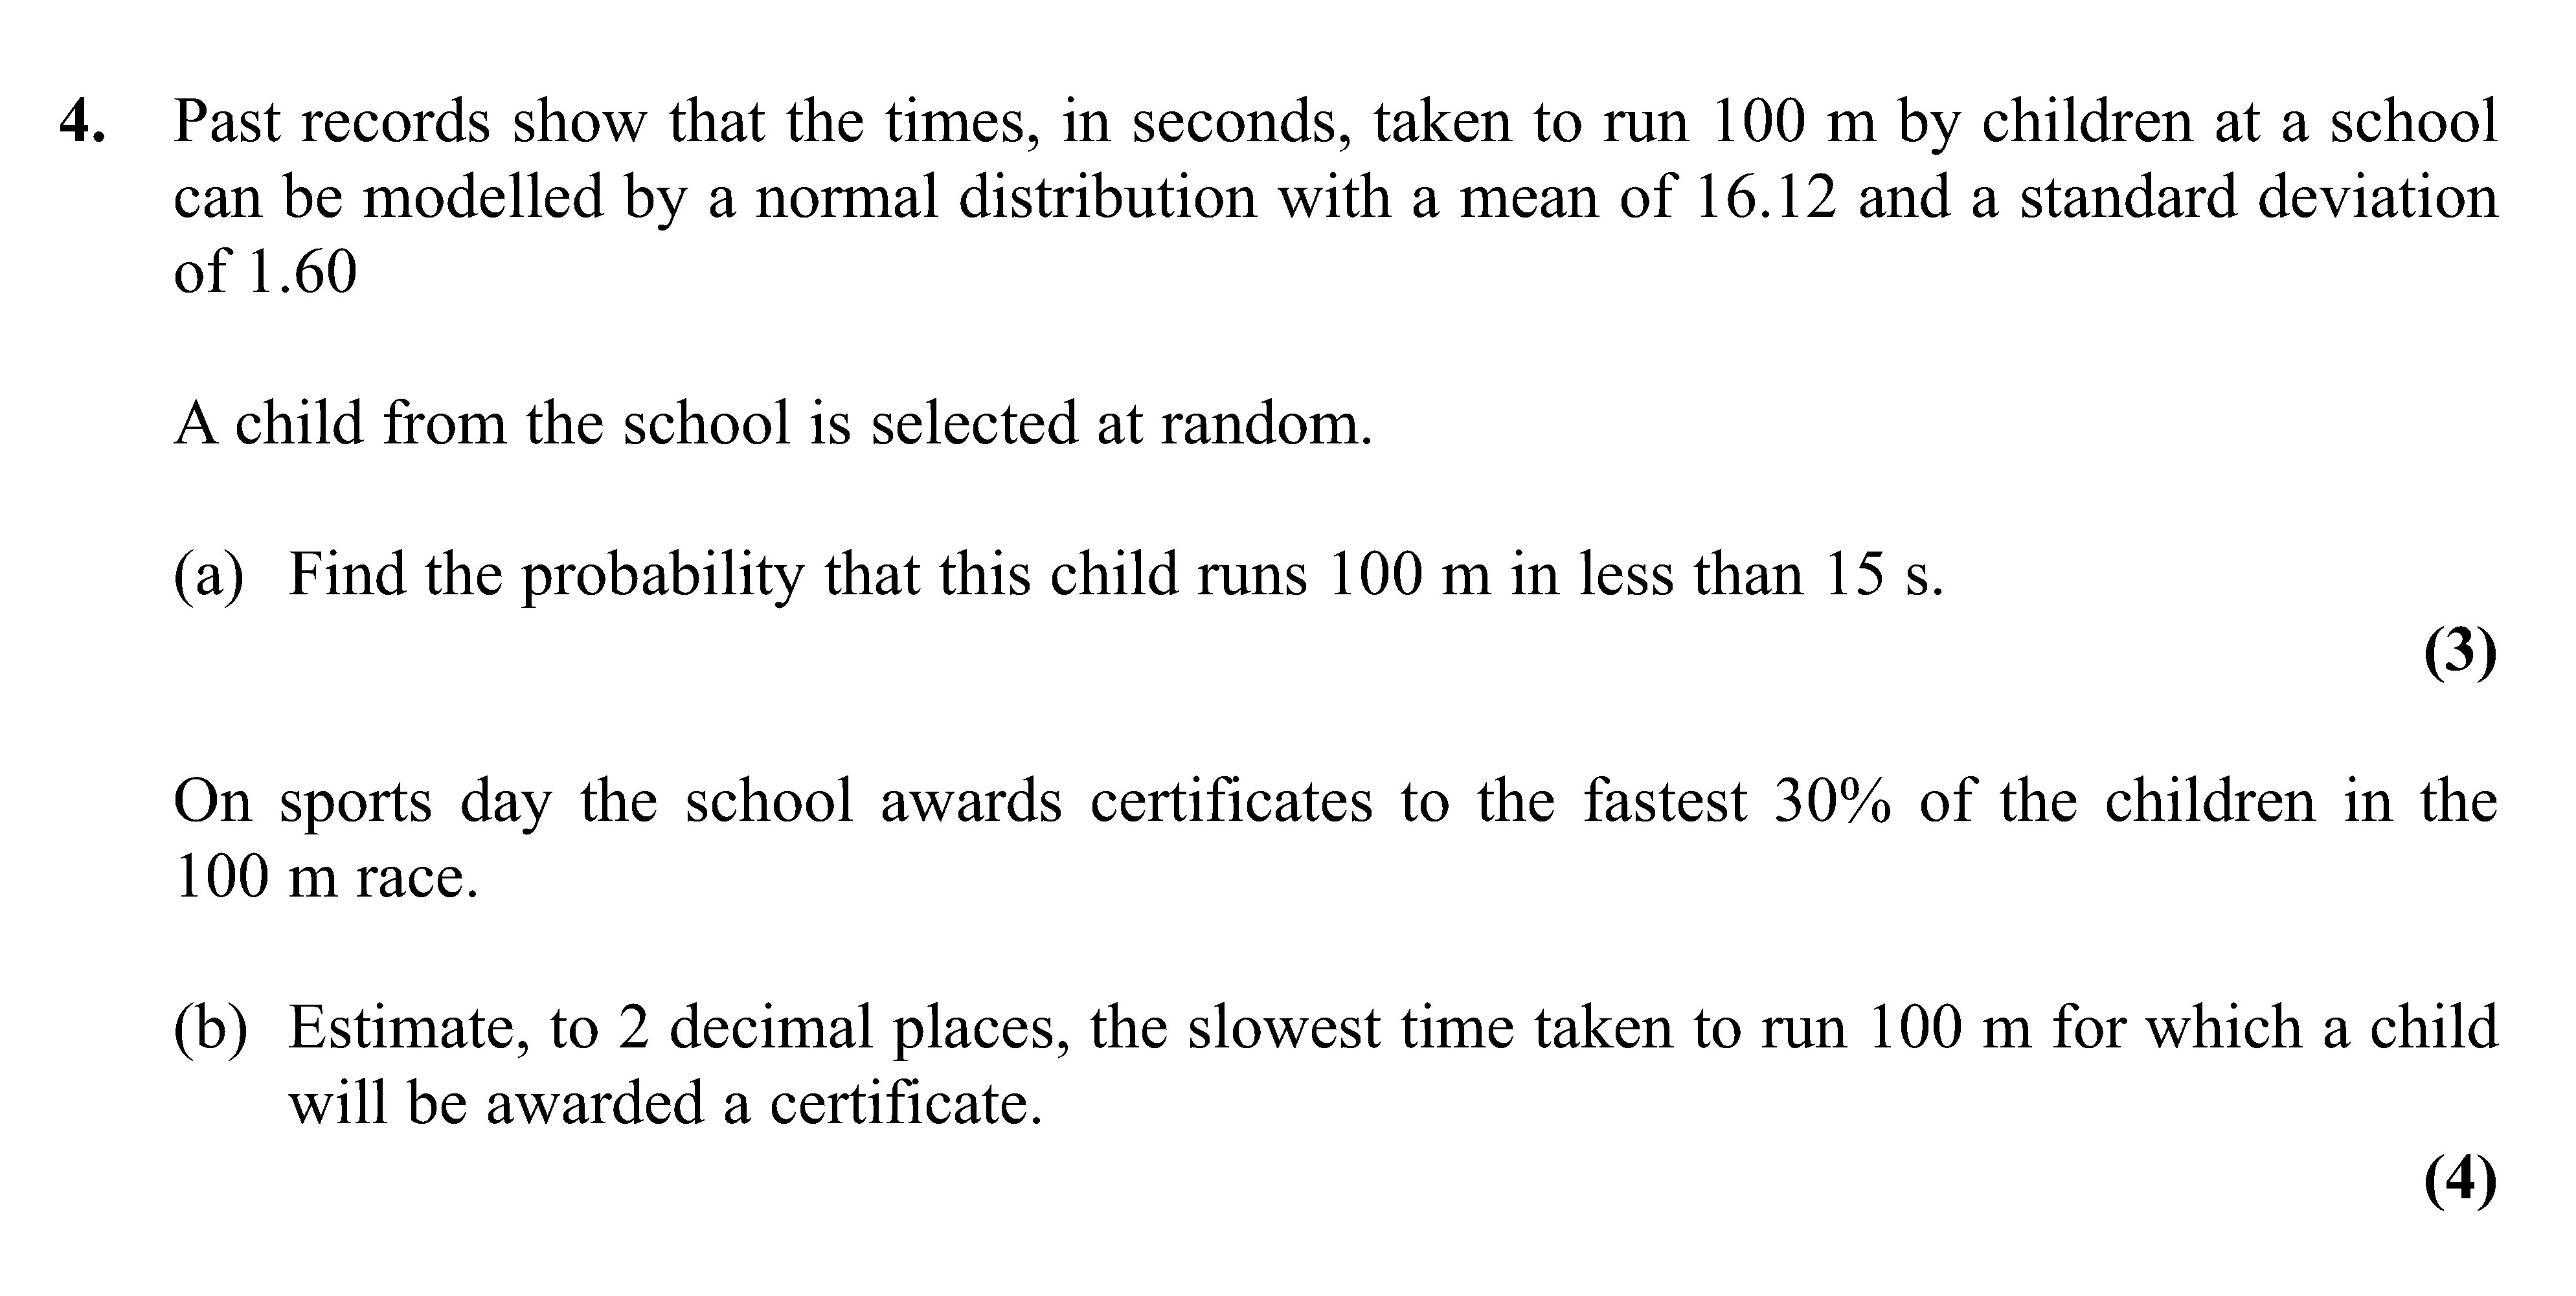
Past records show that the times, in seconds, taken to run 100 m by children at a school can be modelled by a normal distribution with a mean of 16.12 and a standard... show full transcript
Worked Solution & Example Answer:Past records show that the times, in seconds, taken to run 100 m by children at a school can be modelled by a normal distribution with a mean of 16.12 and a standard deviation of 1.60 A child from the school is selected at random - Edexcel - A-Level Maths Statistics - Question 4 - 2011 - Paper 2
Step 1
Find the probability that this child runs 100 m in less than 15 s.

Answer
To solve this, we need to standardize the value 15 using the z-score formula:
Where:
- (the value we are looking at)
- (mean)
- (standard deviation)
Calculating the z-score:
Next, we refer to the standard normal distribution table to find the probability:
Thus, the probability that the child runs 100 m in less than 15 s is approximately 0.242.
Step 2
Estimate, to 2 decimal places, the slowest time taken to run 100 m for which a child will be awarded a certificate.
Answer
To find the cut-off time for the fastest 30% of the children, we need to find the z-score corresponding to the 70th percentile (since the slowest 30% means we are looking at the top 70%).
From the z-table, the z-score for the 70th percentile is approximately 0.524. We can now use the z-score formula again:
Rearranging for :
Substituting in the known values:
= 16.9584 $$ Rounding to two decimal places gives: $$ t \approx 16.96 $$ Therefore, the slowest time taken to run 100 m for which a child will be awarded a certificate is approximately 16.96 seconds.