A random sample of 15 days is taken from the large data set for Perth in June and July 1987 - Edexcel - A-Level Maths Statistics - Question 2 - 2020 - Paper 1
Question 2
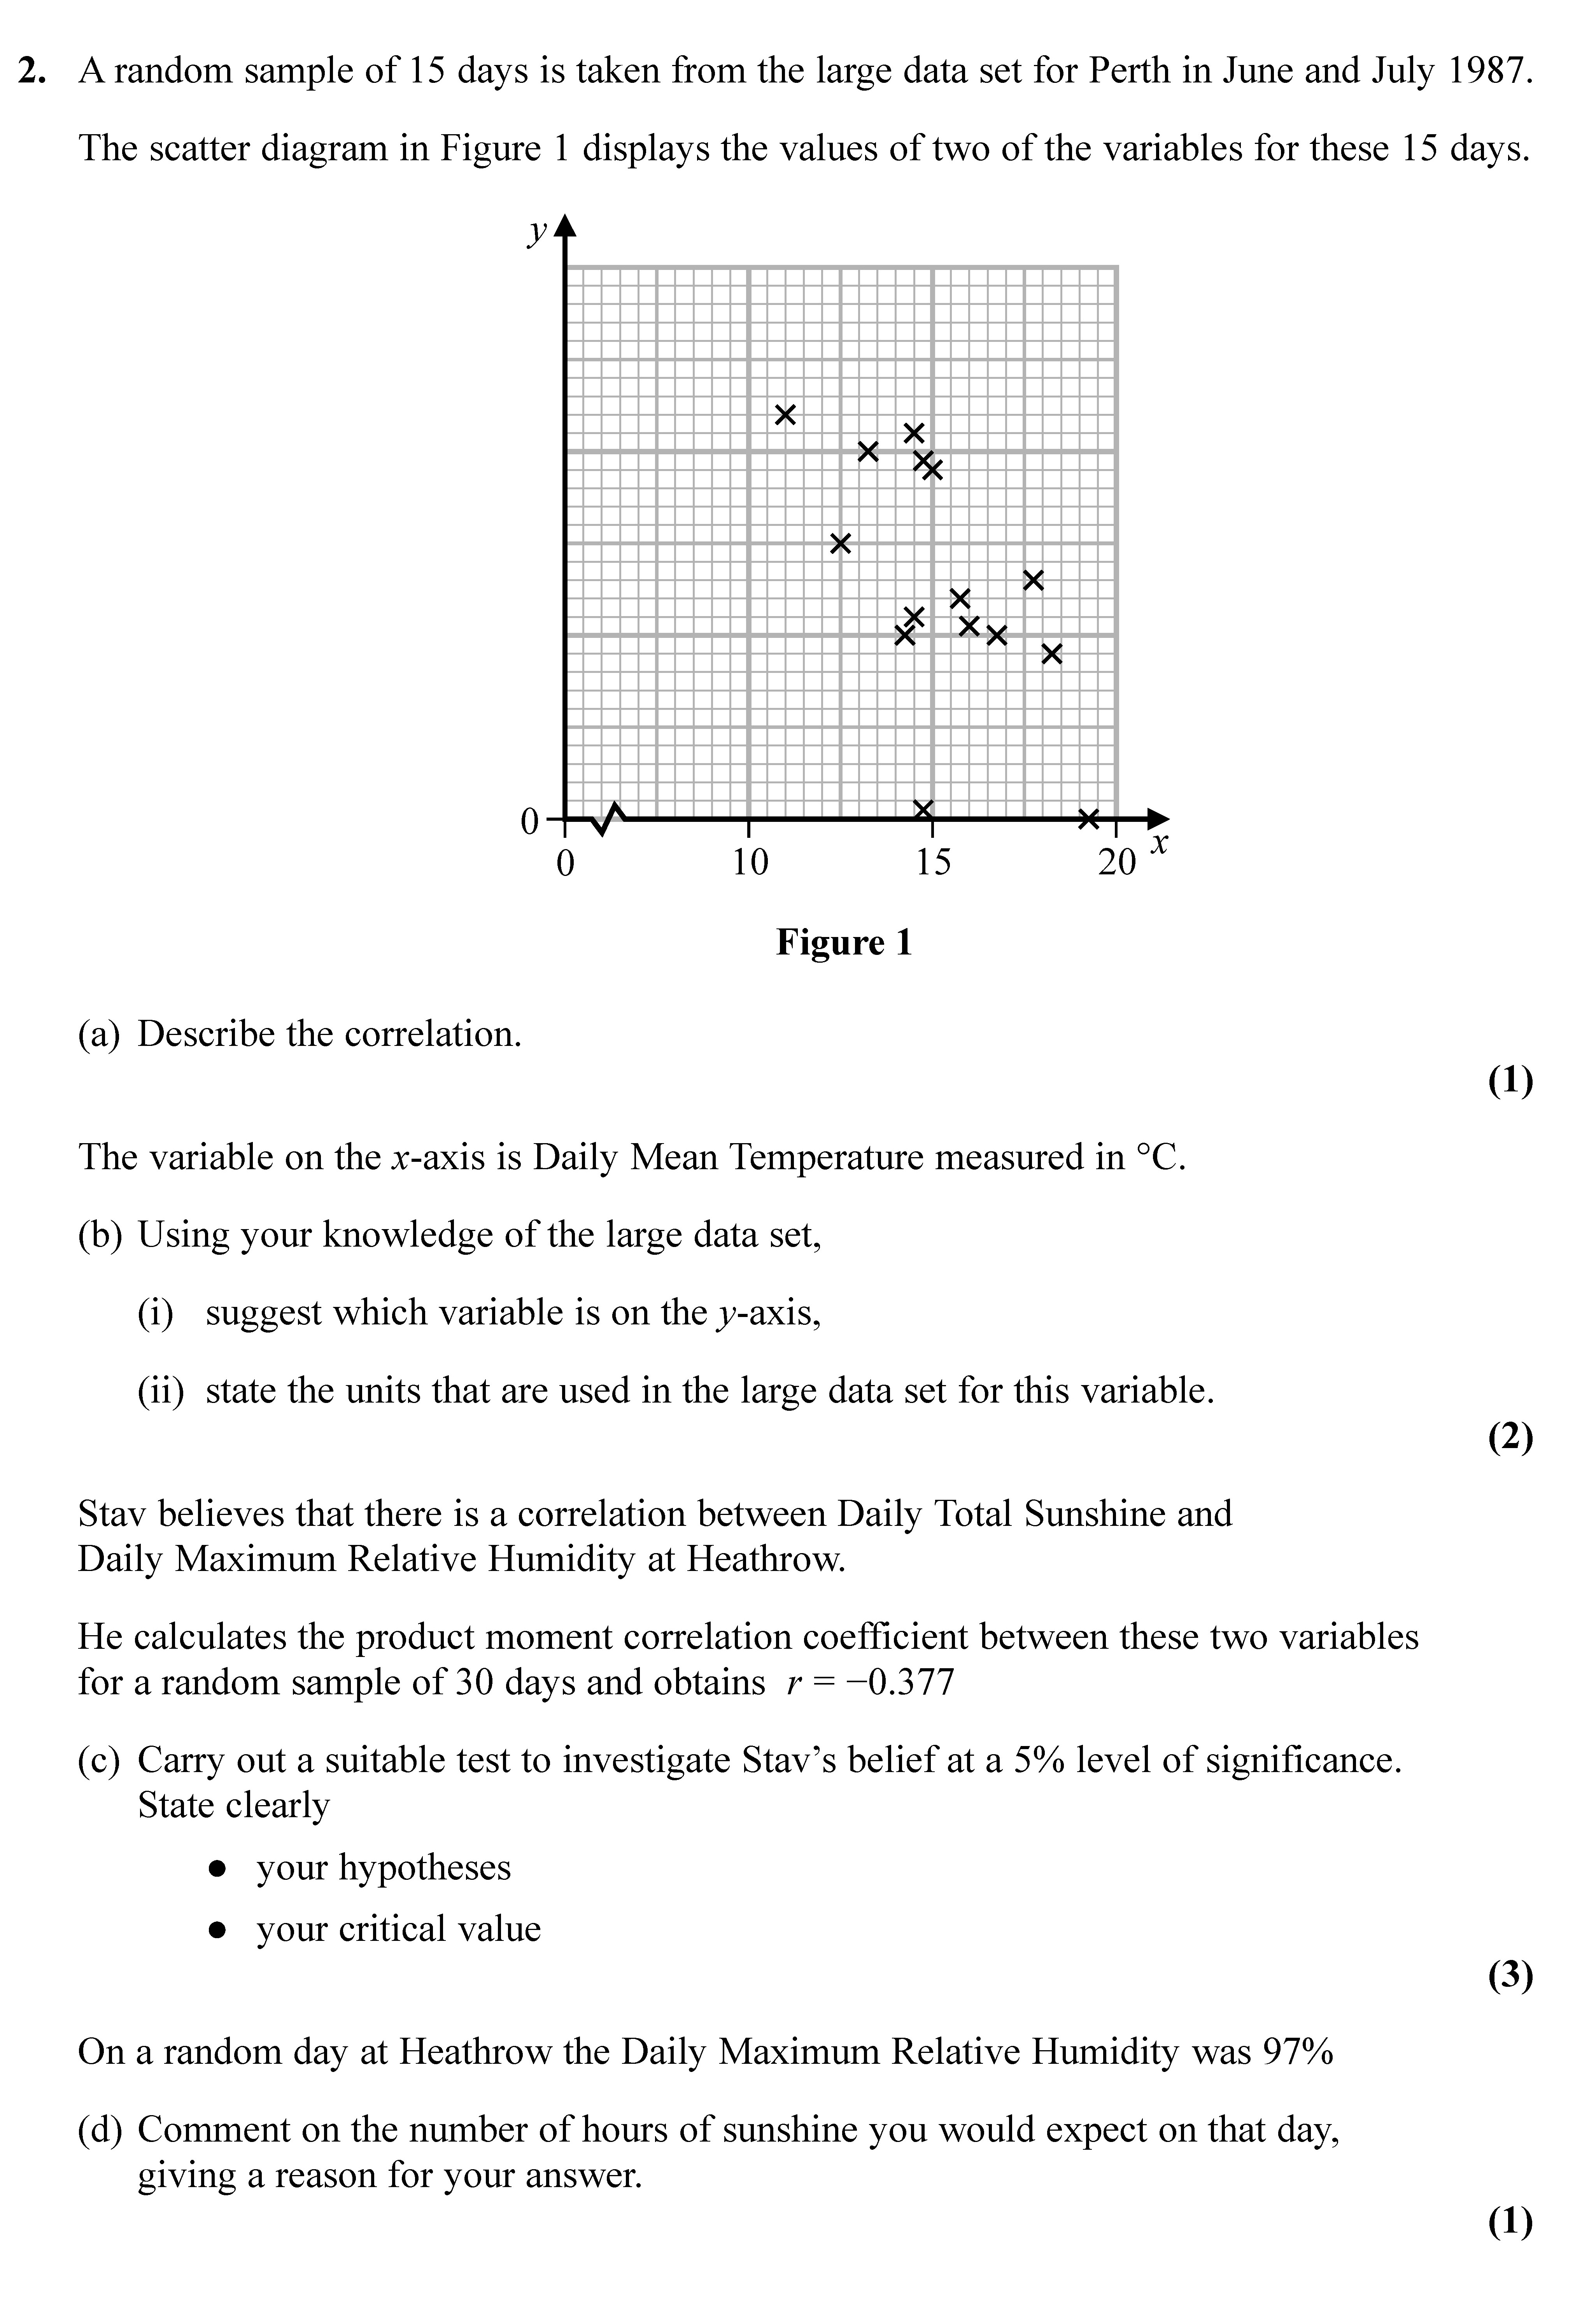
A random sample of 15 days is taken from the large data set for Perth in June and July 1987.
The scatter diagram in Figure 1 displays the values of two of the variab... show full transcript
Worked Solution & Example Answer:A random sample of 15 days is taken from the large data set for Perth in June and July 1987 - Edexcel - A-Level Maths Statistics - Question 2 - 2020 - Paper 1
Step 1
Describe the correlation.
96%
114 rated
Only available for registered users.
Sign up now to view full answer, or log in if you already have an account!
Answer
The scatter plot indicates a negative correlation between the two variables, as the points generally slope downwards from left to right. This suggests that as the Daily Mean Temperature increases, the Daily Total Sunshine decreases.
Step 2
Using your knowledge of the large data set, suggest which variable is on the y-axis.
99%
104 rated
Only available for registered users.
Sign up now to view full answer, or log in if you already have an account!
Answer
The variable on the y-axis is likely to be Daily Total Sunshine, as it is typically measured against temperature in various datasets.
Step 3
State the units that are used in the large data set for this variable.
96%
101 rated
Only available for registered users.
Sign up now to view full answer, or log in if you already have an account!
Answer
The units for Daily Total Sunshine are usually measured in hours.
Step 4
Carry out a suitable test to investigate Stav's belief at a 5% level of significance.
98%
120 rated
Only available for registered users.
Sign up now to view full answer, or log in if you already have an account!
Answer
Hypotheses:
Null Hypothesis (H0): There is no correlation between Daily Total Sunshine and Daily Maximum Relative Humidity (ρ = 0).
Alternative Hypothesis (H1): There is a correlation (ρ < 0).
Critical value:
At a significance level of 5%, and given the sample size of 30, we would refer to a correlation coefficient table. The critical value for a one-tailed test with df = 28 is approximately -0.361.
Since calculated r = -0.377 falls below -0.361, we reject the null hypothesis, indicating a significant negative correlation.
Step 5
Comment on the number of hours of sunshine you would expect on that day, and give a reason for your answer.
97%
117 rated
Only available for registered users.
Sign up now to view full answer, or log in if you already have an account!
Answer
The Daily Maximum Relative Humidity was recorded at 97%, which indicates that the day is likely to be very cloudy or foggy. Therefore, one would expect the hours of sunshine to be lower than average, as high humidity typically correlates with lower sunshine duration.