Photo AI
A teacher selects a random sample of 56 students and records, to the nearest hour, the time spent watching television in a particular week - Edexcel - A-Level Maths Statistics - Question 5 - 2010 - Paper 2
Question 5
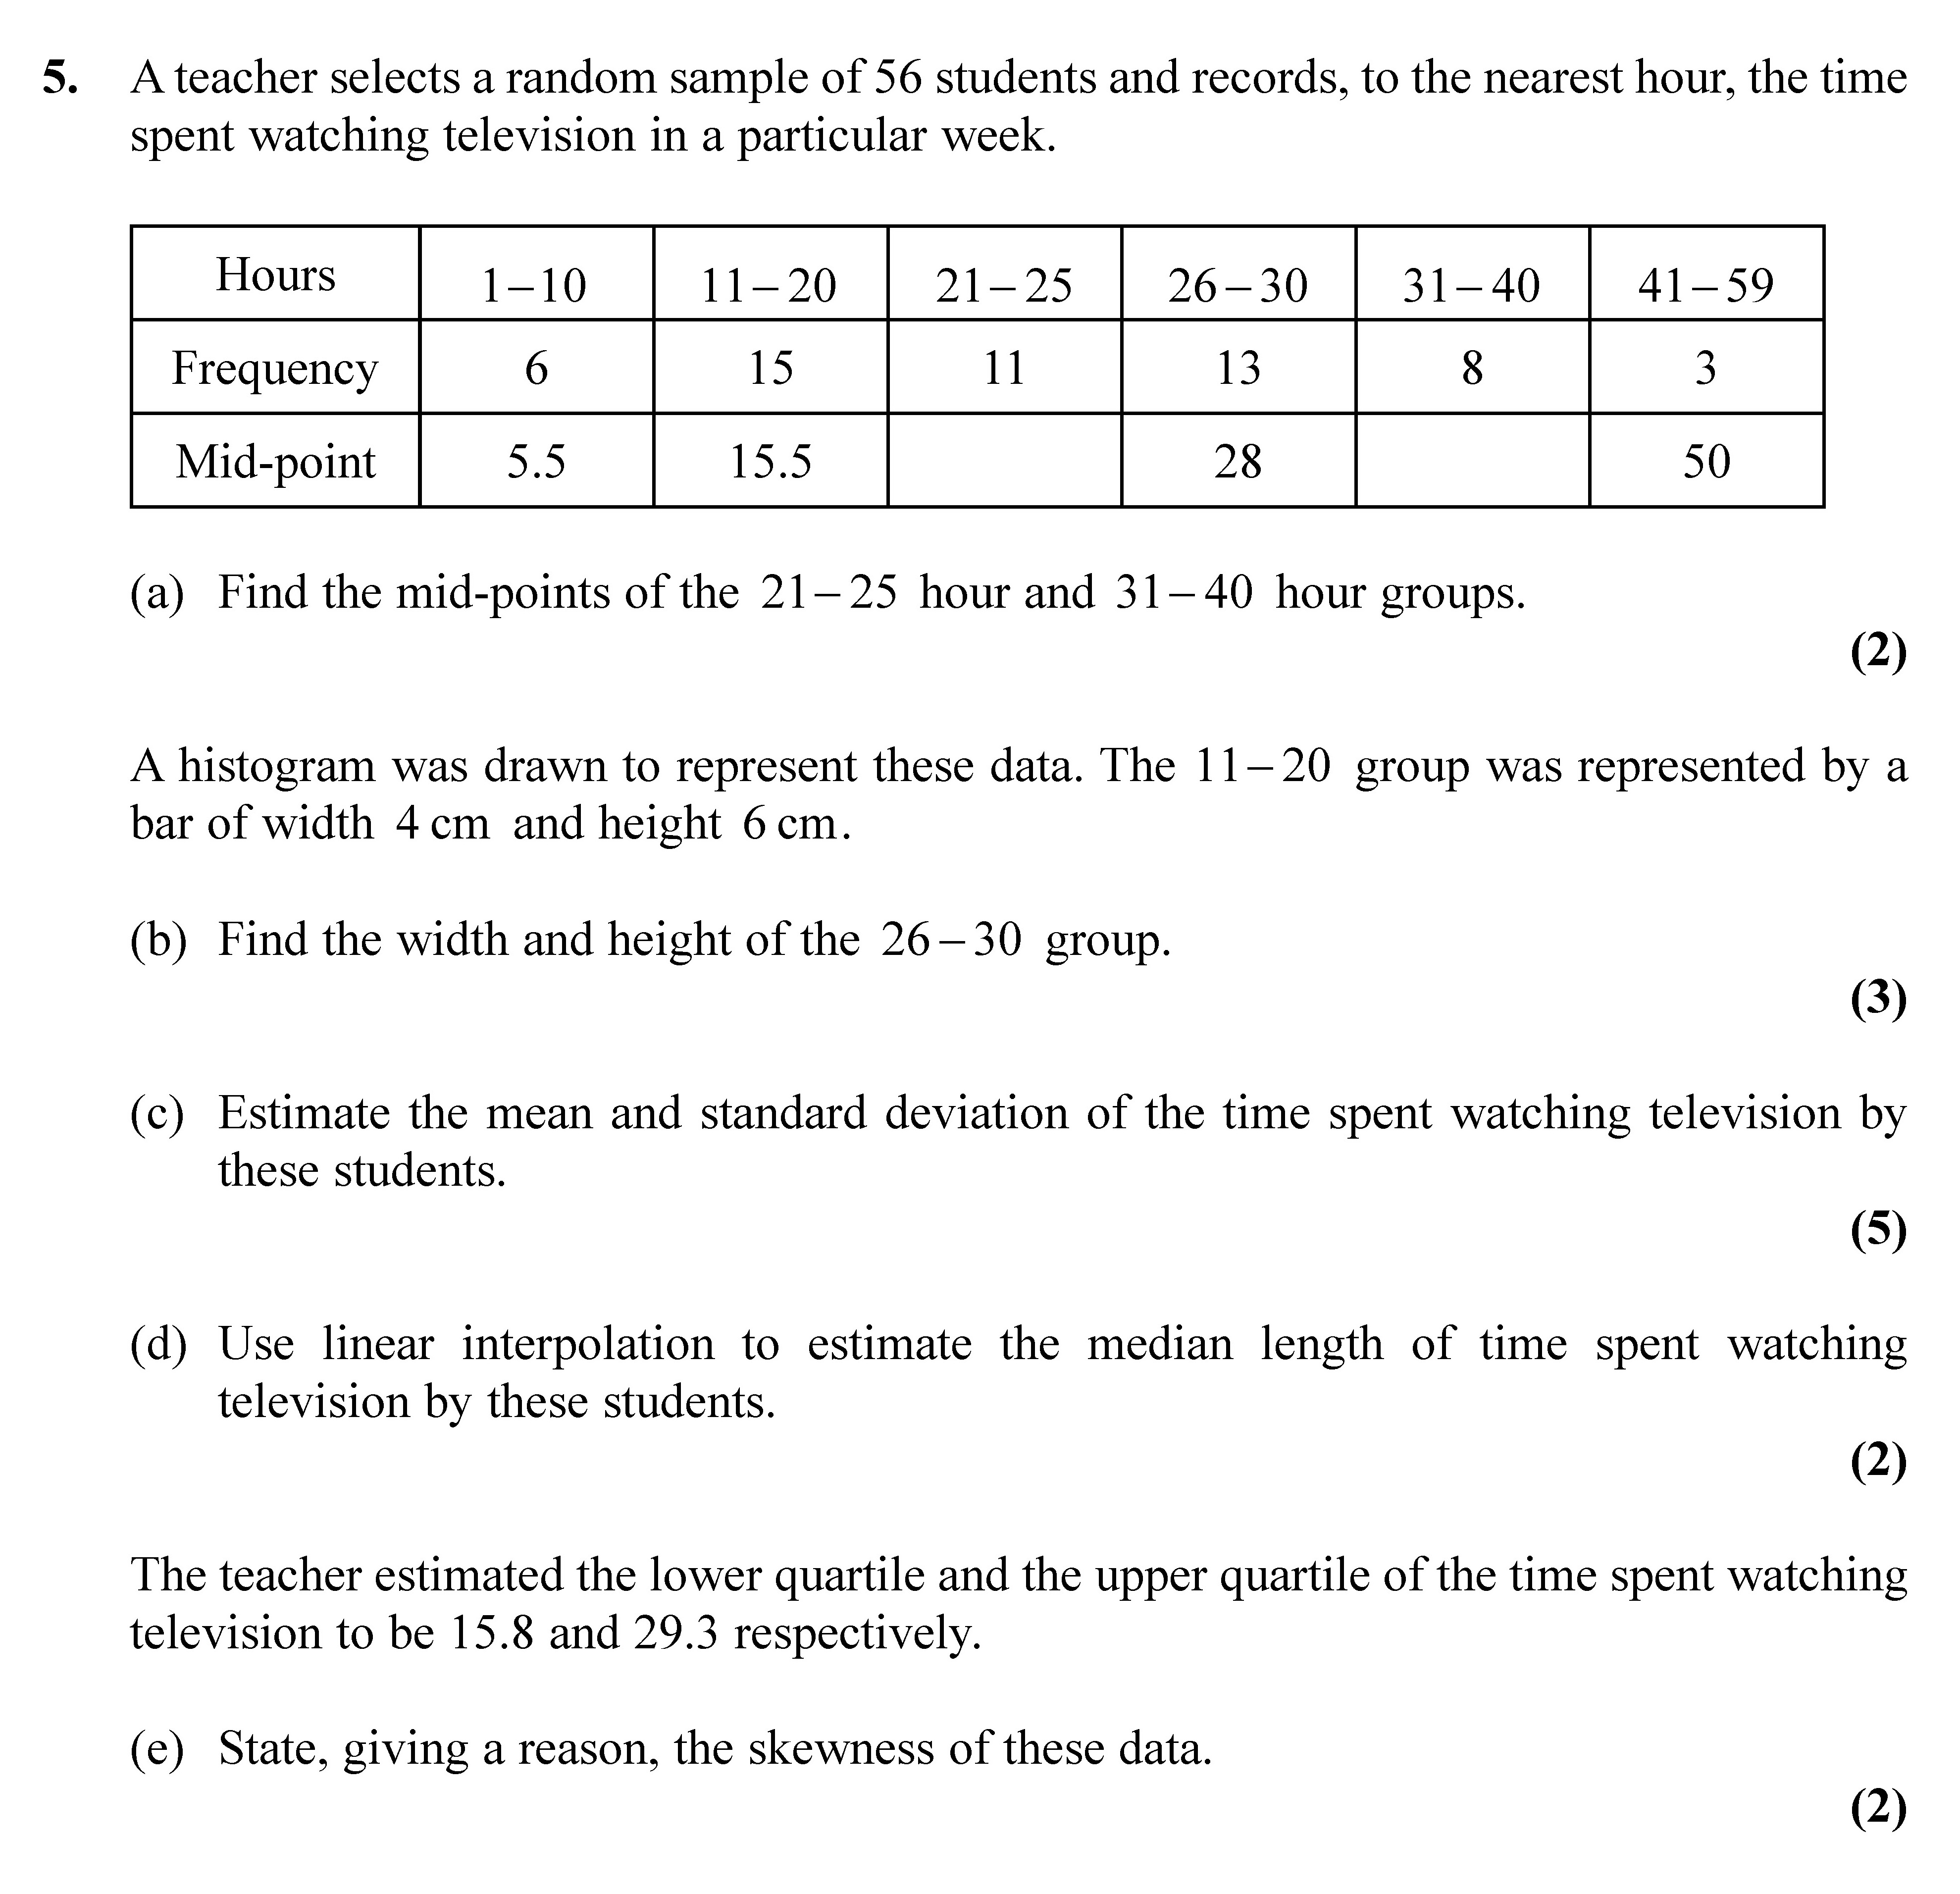
A teacher selects a random sample of 56 students and records, to the nearest hour, the time spent watching television in a particular week. | Hours | 1–10 | 11–2... show full transcript
Worked Solution & Example Answer:A teacher selects a random sample of 56 students and records, to the nearest hour, the time spent watching television in a particular week - Edexcel - A-Level Maths Statistics - Question 5 - 2010 - Paper 2
Step 1

Step 2
Find the width and height of the 26–30 group.
Answer
The width of the 26–30 hour group can be derived from the histogram bars. Given that the 11–20 group has a width of 4 cm and represents 10 units, we can work out that:
- Width of 5 units = 2 cm (calculating the units per cm).
For the height, using the frequency of 13 for the 26–30 group and the calculated width, we find:
- Height = (Frequency/Width) x scale = (13 units / 5 units) x 6 cm = 10.4 cm.
Step 3
Estimate the mean and standard deviation of the time spent watching television by these students.
Answer
To compute the mean, use the mid-points and frequencies: ext{Mean} = rac{(5.5 imes 6) + (15.5 imes 15) + (23 imes 11) + (28 imes 13) + (35 imes 8) + (50 imes 3)}{56} = rac{1316.5}{56} = 23.5
Next, calculate the variance and then the standard deviation: ext{Variance} = rac{ ext{Sum of } (f imes (x - ext{Mean})^2)}{56} where f is the frequency and x is the mid-point. After calculation, the standard deviation
Step 4
Use linear interpolation to estimate the median length of time spent watching television by these students.
Answer
The cumulative frequency shows that the median falls within the 26–30 hour group. Using the values:
- Median = Q2 = 28 – (56/2 - 25) / 13 x 5 = 26.38 gives a value of approximately 26.4.
Step 5