Photo AI
Charlie is studying the time it takes members of his company to travel to the office - Edexcel - A-Level Maths Statistics - Question 4 - 2018 - Paper 2
Question 4
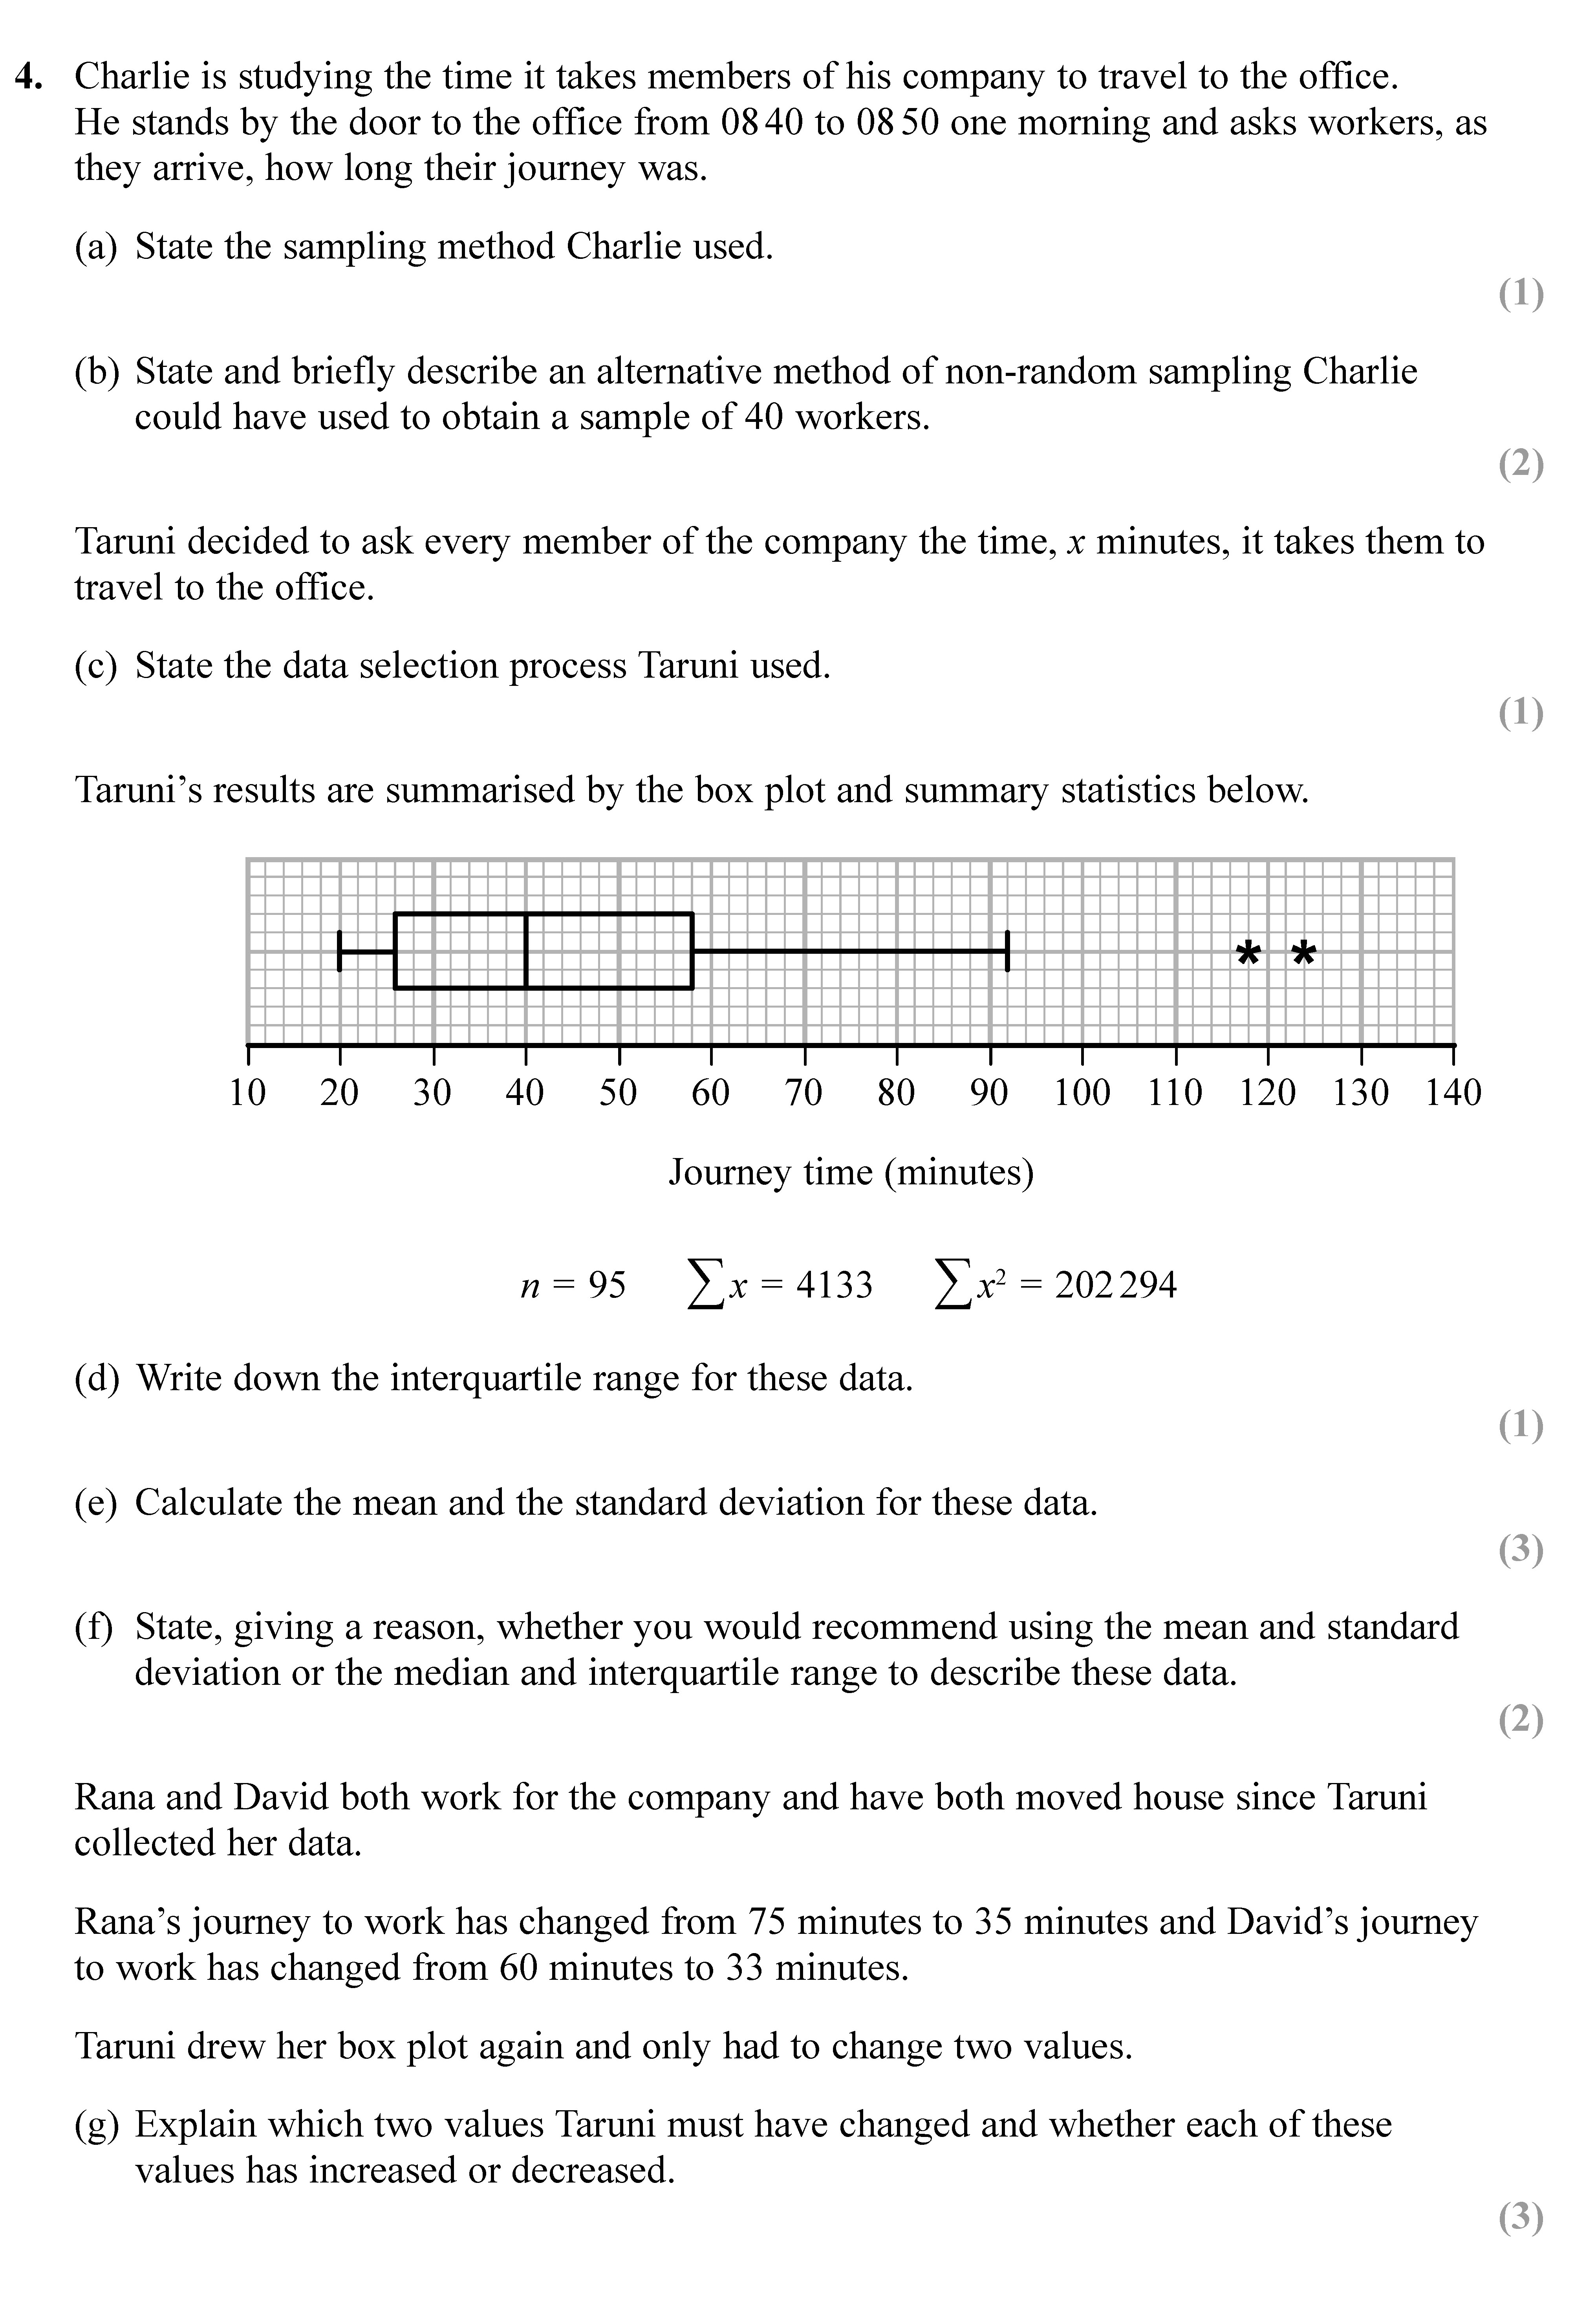
Charlie is studying the time it takes members of his company to travel to the office. He stands by the door to the office from 08:40 to 08:50 one morning and asks wo... show full transcript
Worked Solution & Example Answer:Charlie is studying the time it takes members of his company to travel to the office - Edexcel - A-Level Maths Statistics - Question 4 - 2018 - Paper 2
Step 1

Step 2
State and briefly describe an alternative method of non-random sampling Charlie could have used to obtain a sample of 40 workers.
Answer
An alternative method is quota sampling. In this method, Charlie could define specific categories (e.g., age, department) and select a predetermined number of participants from each category until he reaches a total of 40 workers. This would ensure diversity in the sample without random selection.
Step 3
Step 4
Step 5
Calculate the mean and the standard deviation for these data.
Answer
The mean is calculated using the sum of the data ( rac{4133}{95}) which results in approximately 43.5 minutes. The standard deviation is calculated using the formula: ext{s.d.} = rac{ ext{sum of squares} - ext{mean}^2}{n} = rac{202294}{95} - (43.5)^2 ext{, which is approximately } 15.4 ext{ minutes.}
Step 6
State, giving a reason, whether you would recommend using the mean and standard deviation or the median and interquartile range to describe these data.
Answer
I would recommend using the median and interquartile range (IQR) due to the presence of outliers in the data. The mean and standard deviation can be influenced heavily by extreme values, making them less representative of the central tendency and variability of the data in such cases.
Step 7
Explain which two values Taruni must have changed and whether each of these values increased or decreased.
Answer
Taruni changed the journey times for Rana and David. Rana's time decreased from 75 minutes to 35 minutes, indicating a significant reduction of 40 minutes. David's time decreased from 60 minutes to 33 minutes, indicating a decrease of 27 minutes. Both changes represent a reduction in journey times.