Photo AI
A policeman records the speed of the traffic on a busy road with a 30 mph speed limit - Edexcel - A-Level Maths Statistics - Question 5 - 2012 - Paper 2
Question 5
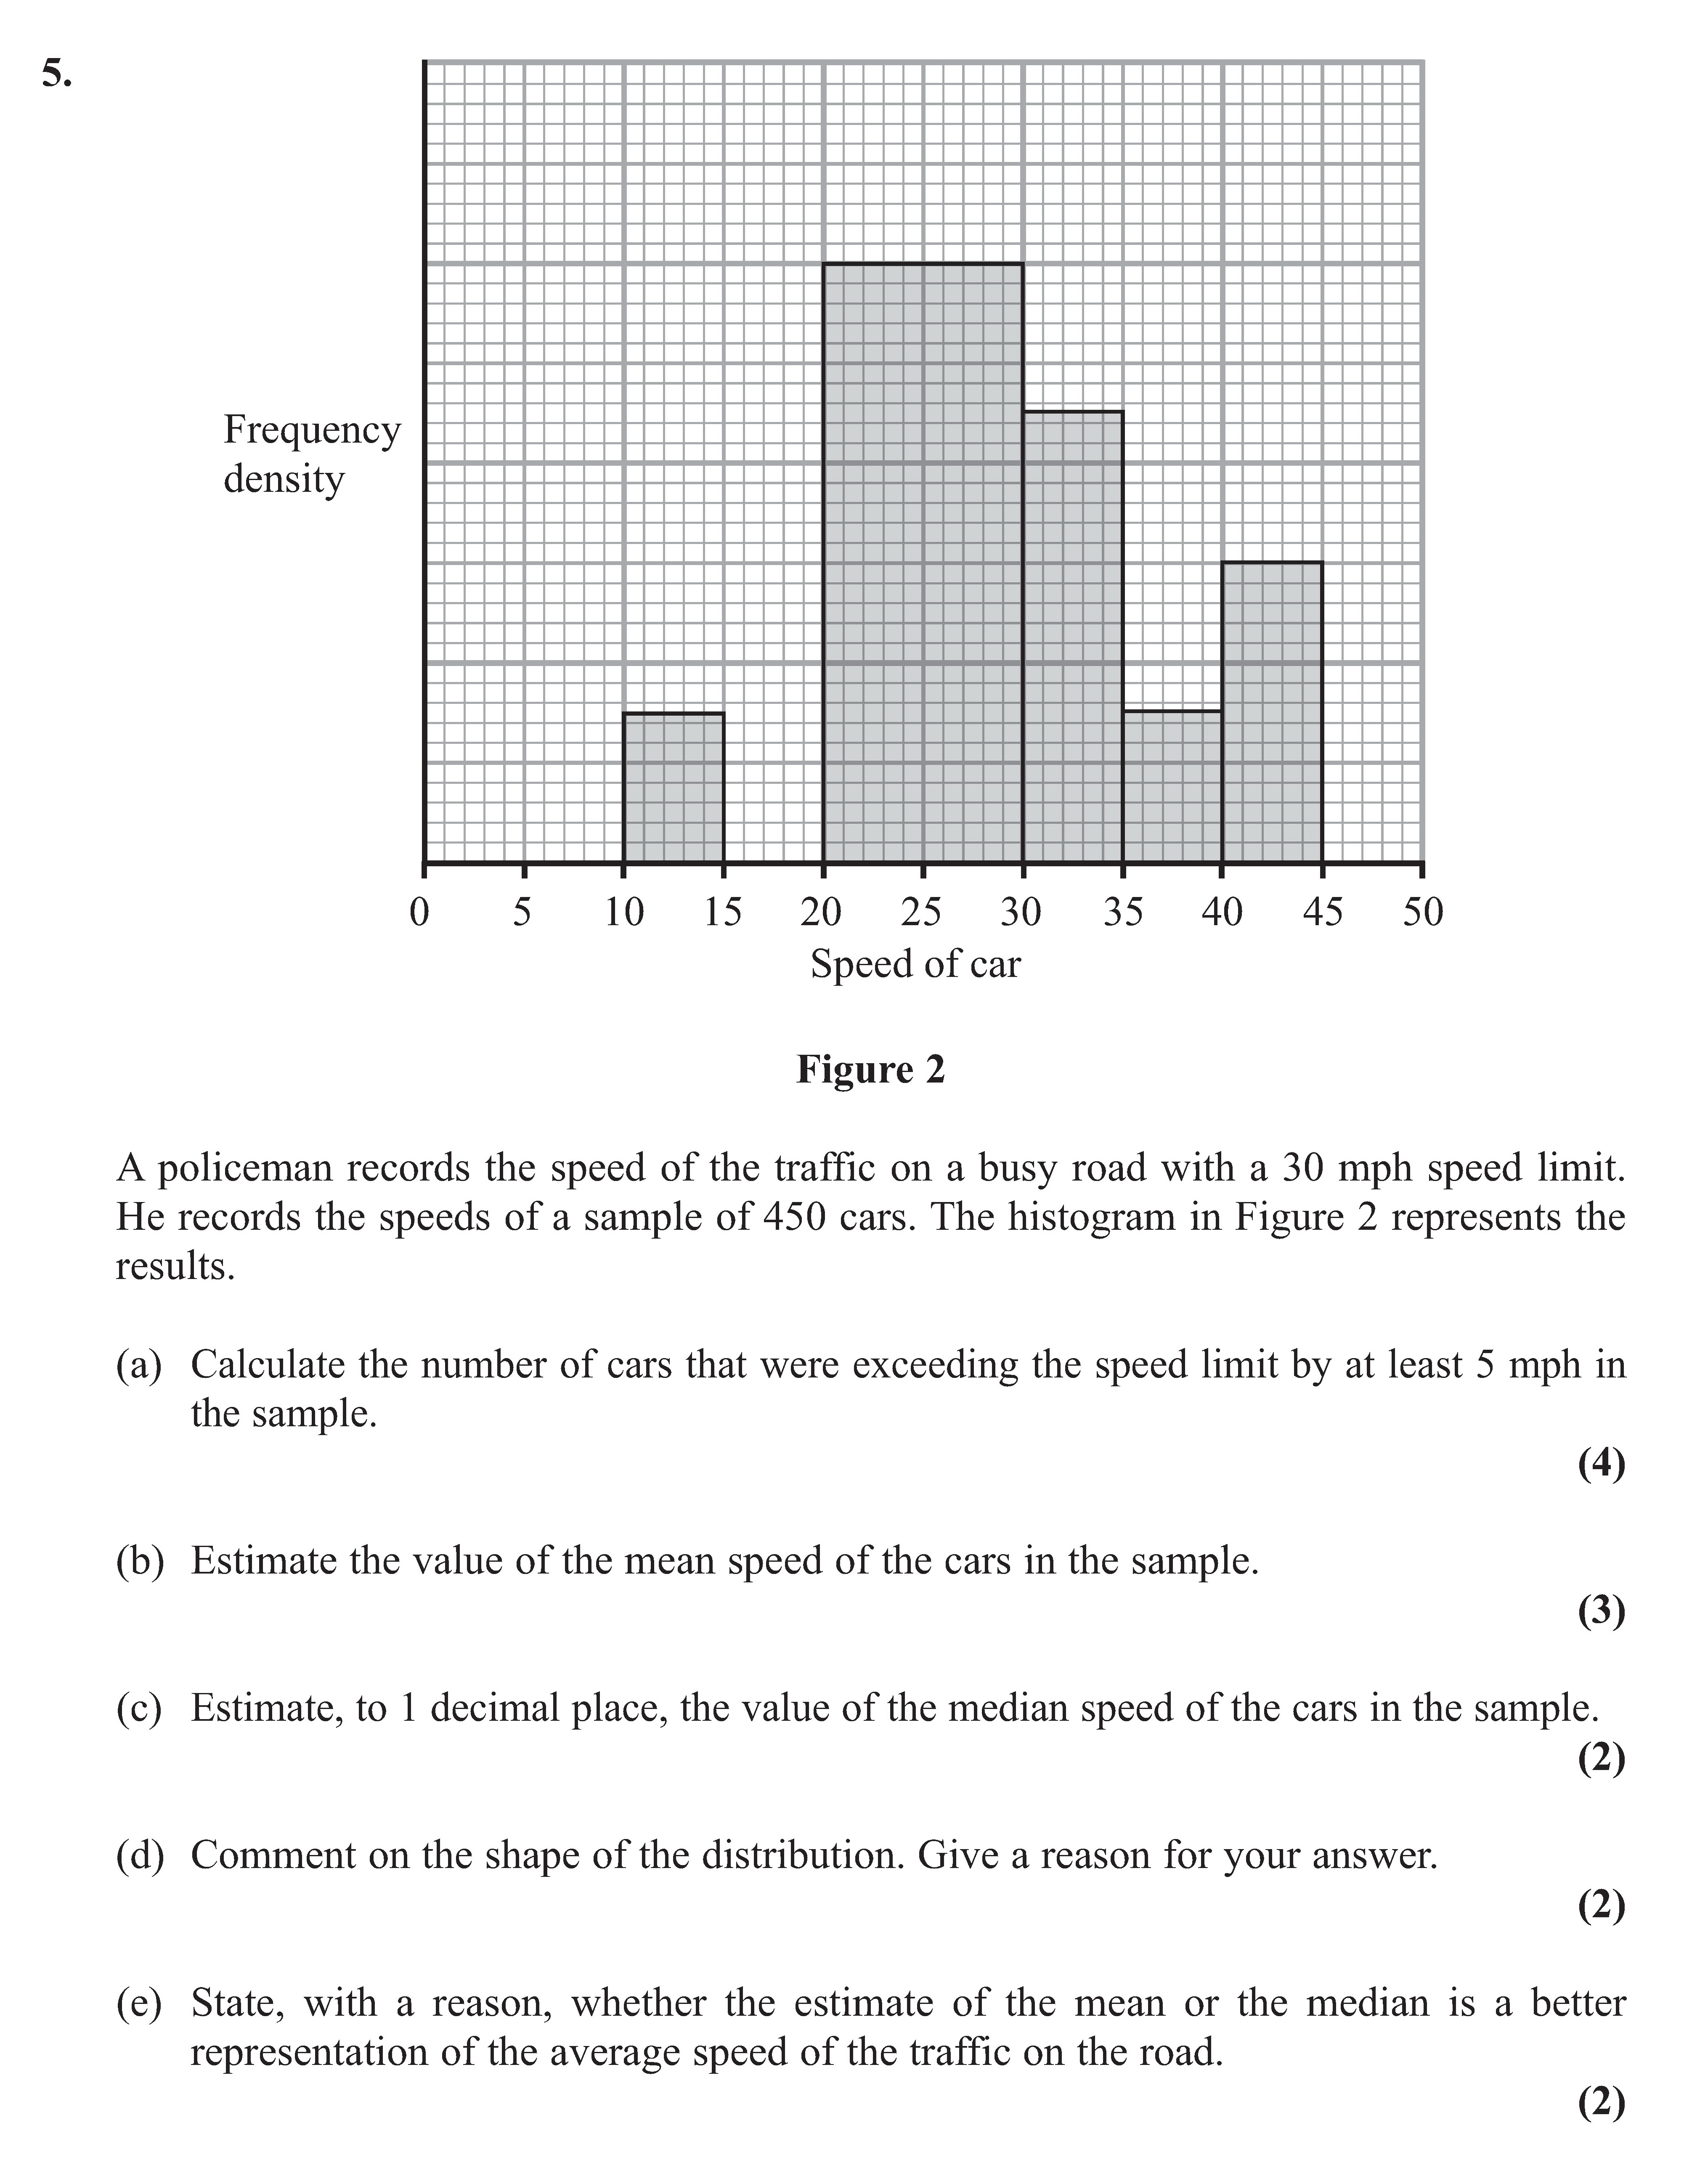
A policeman records the speed of the traffic on a busy road with a 30 mph speed limit. He records the speeds of a sample of 450 cars. The histogram in Figure 2 repre... show full transcript
Worked Solution & Example Answer:A policeman records the speed of the traffic on a busy road with a 30 mph speed limit - Edexcel - A-Level Maths Statistics - Question 5 - 2012 - Paper 2
Step 1
Calculate the number of cars that were exceeding the speed limit by at least 5 mph in the sample.

Answer
To find the number of cars exceeding the speed limit by 5 mph, we first identify the speed limits from the histogram. The speed limit is 30 mph, so we need to consider cars going 35 mph and above.
-
Identify intervals:
- 30-35 mph has a frequency density of 0.2 (2 squares) for the interval (30, 35)
- 35-40 mph has a frequency density of 0.3 (3 squares)
- 40-45 mph has a frequency density of 0.2 (2 squares)
-
Calculate the area for each interval:
- For 30-35 mph: Area = Frequency Density × Width = square
- For 35-40 mph: Area = squares
- For 40-45 mph: Area = square
-
Total cars exceeding limit: Areas: 1 (30-35 mph) + 1.5 (35-40 mph) + 1 (40-45 mph) = 3.5 squares.
Number of cars in the exceeding category = Total number of cars × (Total area exceeding limit/Total area) = 450 × rac{3.5}{18} ≈ 87.5, which we round down to 87 cars.
Step 2
Estimate the value of the mean speed of the cars in the sample.
Answer
To estimate the mean speed, we calculate the midpoints for each speed interval and multiply these by their frequency.
-
Midpoints:
- 0-5 mph: 2.5
- 5-10 mph: 7.5
- 10-15 mph: 12.5
- 15-20 mph: 17.5
- 20-25 mph: 22.5
- 25-30 mph: 27.5
- 30-35 mph: 32.5
- 35-40 mph: 37.5
- 40-45 mph: 42.5
- 45-50 mph: 47.5
-
Multiply midpoints by frequency:
- Total = (2.5 × 10 + 7.5 × 15 + ... + 42.5 × 9) = Total sum divided by the total number of cars gives the mean speed.
From calculations, the approximate mean speed = mph.
Step 3
Estimate, to 1 decimal place, the value of the median speed of the cars in the sample.
Answer
To estimate the median speed, we find the position of the median in the ordered data:
-
Position of median:
- Median position = rac{450 + 1}{2} = 225.5
-
Cumulative frequencies must reach this position:
- Add up frequencies until reaching 225:
- E.g., cumulative frequencies from groups show that median lies between the intervals 20-25 mph and 25-30 mph.
-
Calculate using linear interpolation:
- Median estimated as a weighted average between these categories.
Final value = approx mph.
Step 4
Comment on the shape of the distribution. Give a reason for your answer.
Answer
The shape of the distribution is positively skewed.
- Reasoning:
- Most of the data clusters towards the lower speeds, with fewer cars recorded at higher speeds.
- Thus, the mean is greater than the median, which is indicative of positive skewness in the data.
Step 5
State, with a reason, whether the estimate of the mean or the median is a better representation of the average speed of the traffic on the road.
Answer
The median is a better representation of the average speed.
- Reasoning:
- The median is less affected by extreme values that can arise from sporadic high-speed cars compared to the mean, which can skew higher. Thus, it provides a more reliable measure of typical traffic speed.