Photo AI
An estate agent is studying the cost of office space in London - Edexcel - A-Level Maths Statistics - Question 2 - 2017 - Paper 1
Question 2
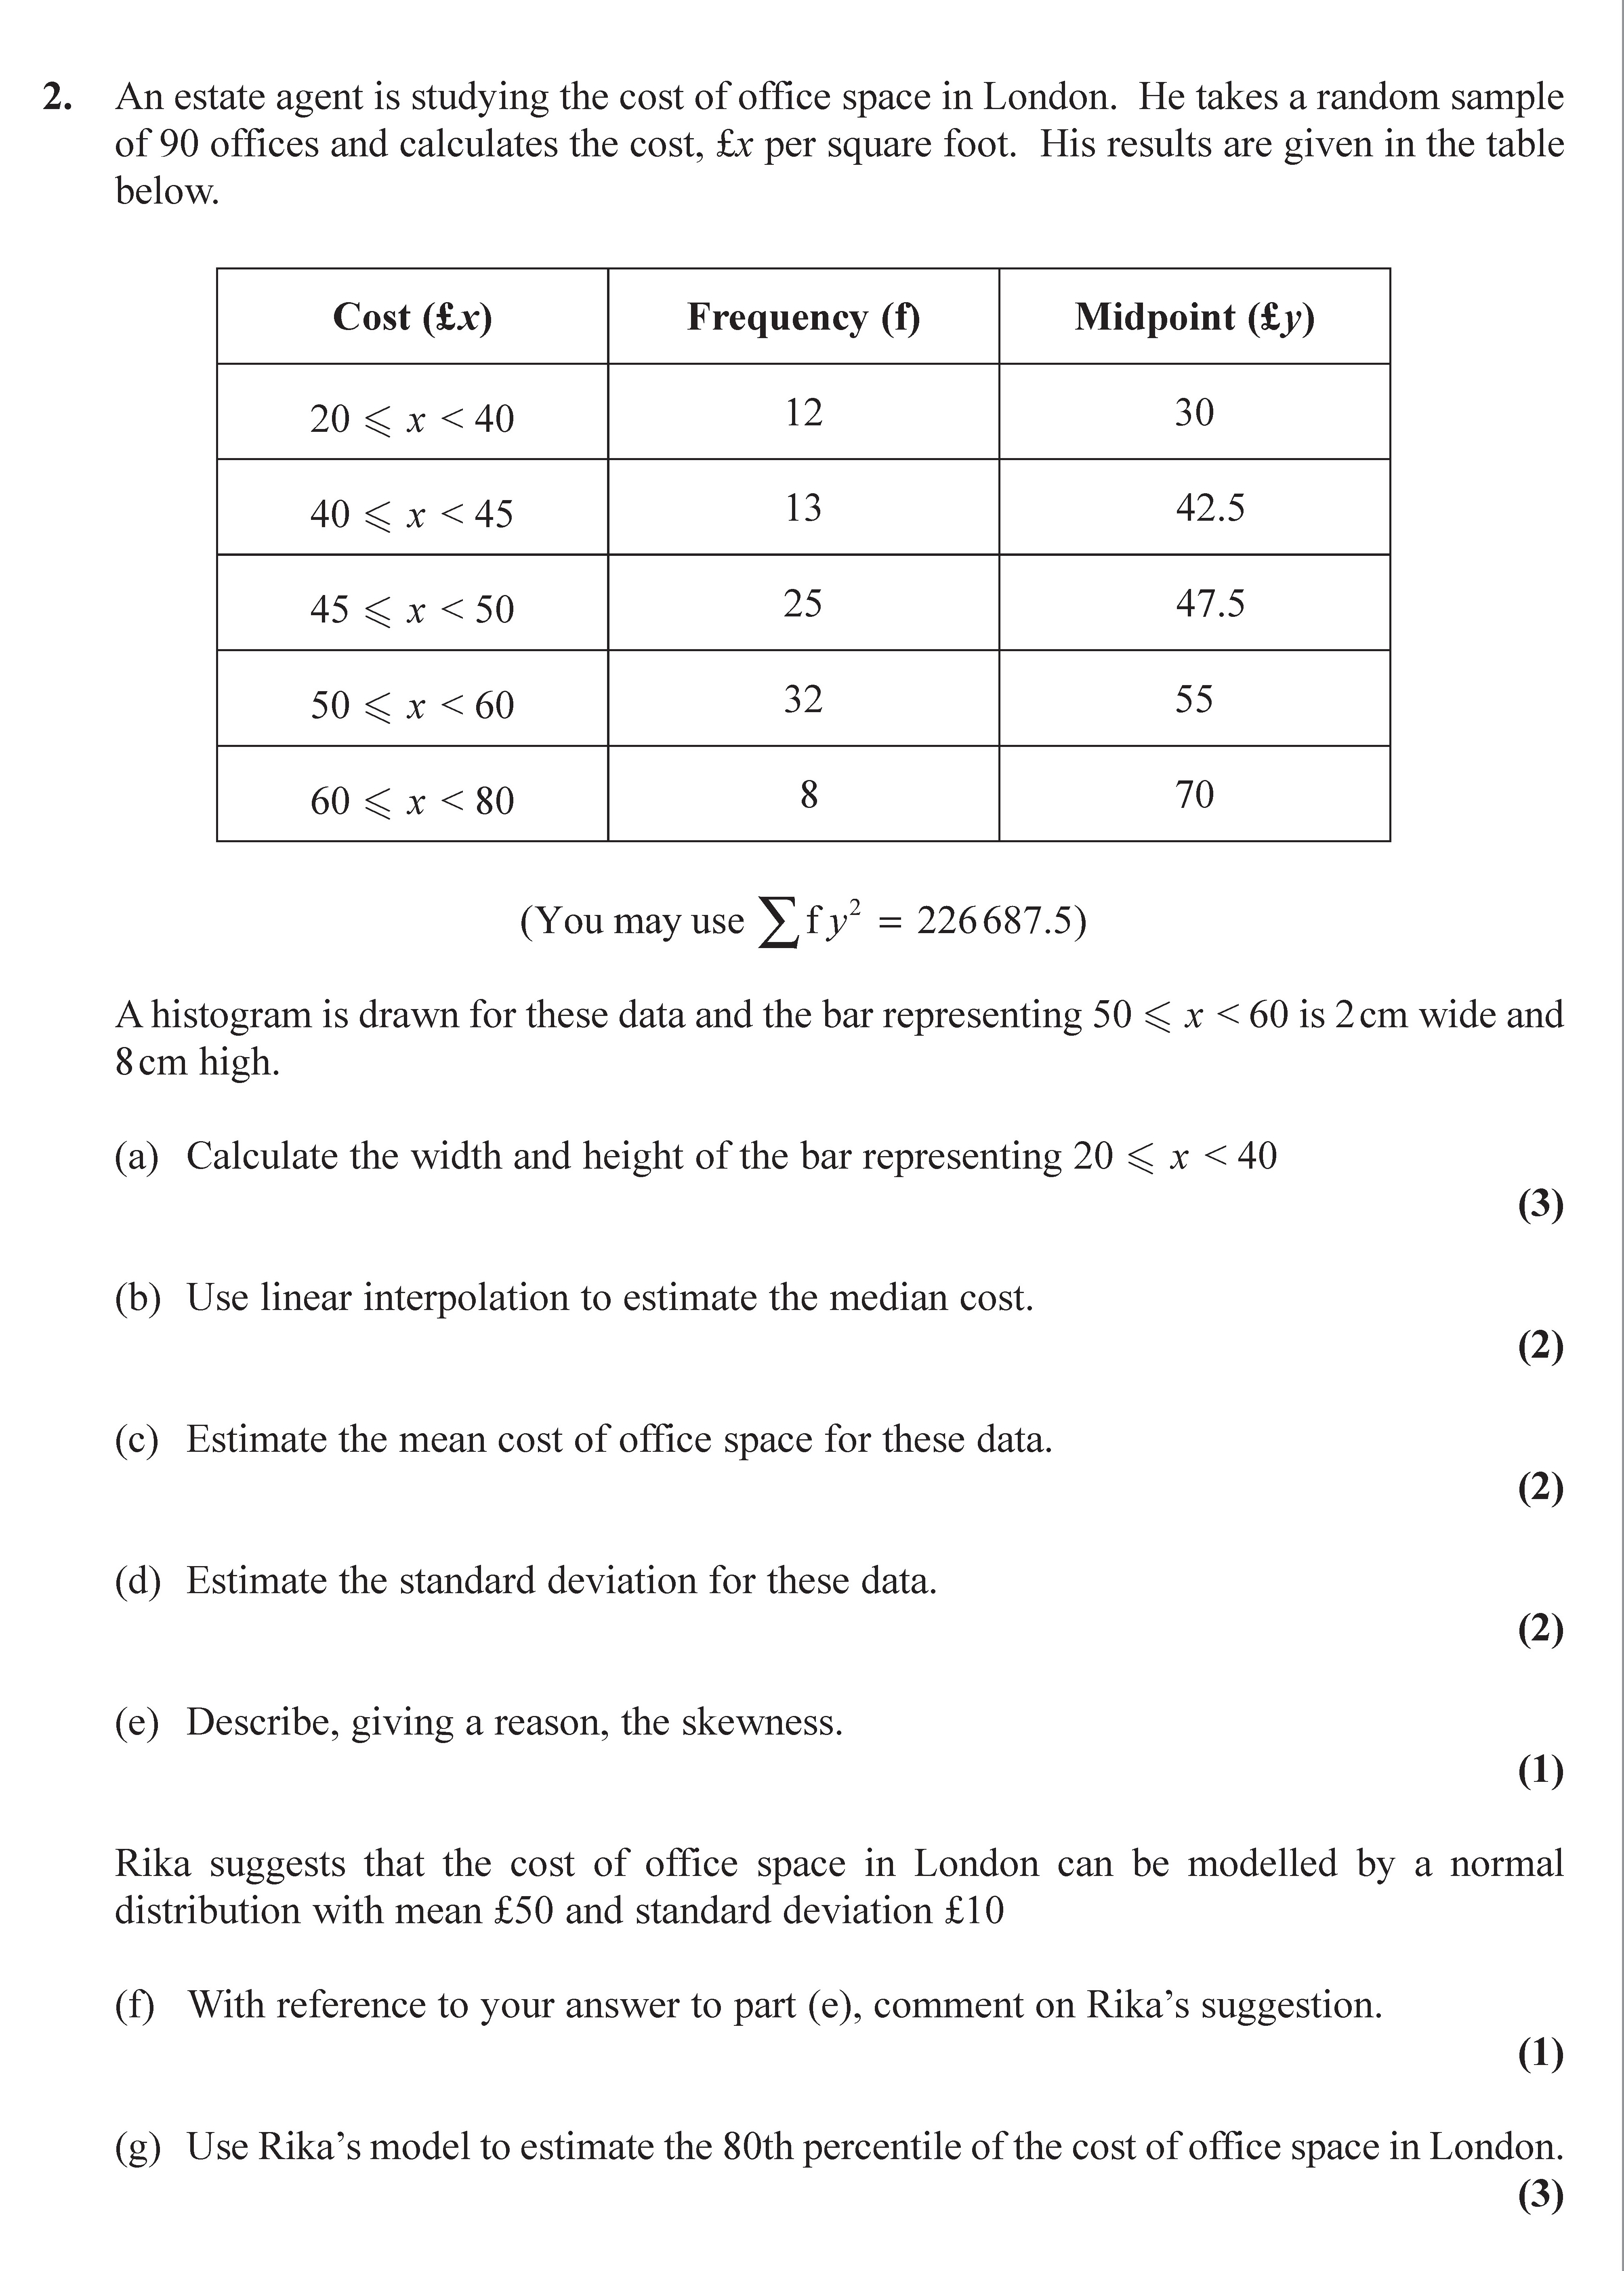
An estate agent is studying the cost of office space in London. He takes a random sample of 90 offices and calculates the cost, £x per square foot. His results are g... show full transcript
Worked Solution & Example Answer:An estate agent is studying the cost of office space in London - Edexcel - A-Level Maths Statistics - Question 2 - 2017 - Paper 1
Step 1
Calculate the width and height of the bar representing 20 ≤ x < 40.

Answer
The width of the bar for the range 20 ≤ x < 40 can be calculated by first determining the widths of the bars. In the histogram, areas are proportional to the frequency. The bar for 50 ≤ x < 60 is given as 2 cm wide and 8 cm high; therefore:
- Width calculation: For bar 20 ≤ x < 40, let's denote the frequency as 12 offices. Since 16 cm² represents 32 offices (which is the bar for 50 ≤ x < 60), the width for 20 ≤ x < 40 is:
[ \text{Width} = \frac{12 \text{ offices}}{32 \text{ offices}} \times 2 \text{ cm} = 0.75 \text{ cm} ]
- Height calculation: The height can be found through:
[ \text{Height} = \frac{12 \text{ offices}}{\text{Width}} = \frac{12}{0.75} = 16 ext{ cm} ]
Step 2
Use linear interpolation to estimate the median cost.
Answer
To find the median, first calculate the cumulative frequency:
- Cumulative frequency for 20 ≤ x < 40: 12
- Cumulative frequency for 40 ≤ x < 45: 12 + 13 = 25
- Cumulative frequency for 45 ≤ x < 50: 25 + 25 = 50
- Cumulative frequency for 50 ≤ x < 60: 50 + 32 = 82
- Cumulative frequency for 60 ≤ x < 80: 82 + 8 = 90
The median is at position ( \frac{90}{2} = 45 ). The median class is 45 ≤ x < 50, where 25 frequencies contribute to 50 in total. Using linear interpolation:
[ Median = L + \frac{\left( \frac{n}{2} - CF \right)}{f} \times c ] Where:
- L = 45 (lower boundary of the median class)
- n = 90 (total frequencies)
- CF = 25 (cumulative frequency before median class)
- f = 25 (frequency of median class)
- c = 5 (class width)
Thus:
[ Median = 45 + \frac{(45 - 25)}{25} \times 5 = 45 + 4 = 49 \text{ (approx)} ]
Step 3
Estimate the mean cost of office space for these data.
Answer
To calculate the mean, use the formula:
[ \text{Mean} = \frac{\sum f y}{n} ] Where:
- ( f y ) is the product of frequency and midpoint,
- n is the total number of observations (90).
Calculating the values:
[ \sum f y = (12 \times 30) + (13 \times 42.5) + (25 \times 47.5) + (32 \times 55) + (8 \times 70) = 360 + 552.5 + 1187.5 + 1760 + 560 = 3920 ]
Substituting:
[ \text{Mean} = \frac{3920}{90} = 43.56 \text{ (approx)} ]
Step 4
Estimate the standard deviation for these data.
Answer
The standard deviation can be estimated using:
[ s = \sqrt{\frac{\sum f (y - \text{Mean})^2}{n}} ] Where:
- Mean was calculated in part (c),
- Each midpoint needs to be substituted accordingly. Compute ( (y - 43.56)^2 ), multiply each by their respective frequency, and sum those products to get ( \sum f (y - \text{Mean})^2 ). Finally, substitute into the formula to find the standard deviation ( s ). This will give the spread of office costs around the mean.
Step 5
Describe, giving a reason, the skewness.
Answer
The skewness can be determined by evaluating the mean and median. If the mean is less than the median, the distribution is negatively skewed; if greater, it is positively skewed. In this case, since Mean = 43.56 is less than Median = 49, we conclude:
The distribution is negatively skewed (or left-skewed) as the tail on the left side is longer.
Step 6
With reference to your answer to part (e), comment on Rika's suggestion.
Answer
Given the negative skewness, Rika's suggestion that the cost can be modeled by a normal distribution may not hold true. A normal distribution assumes symmetry; however, with an evident left skew, using a normal model might not accurately reflect the data's distribution, possibly leading to incorrect conclusions.
Step 7
Use Rika's model to estimate the 80th percentile of the cost of office space in London.
Answer
Using Rika's normal distribution model (mean = £50, standard deviation = £10), we find the 80th percentile using the z-score:
[ P(Z < z) = 0.80 \implies z \approx 0.8416 ] Thus:
[ X = \text{mean} + z \times \text{standard deviation} = 50 + (0.8416 \times 10) \approx 58.416 ] Therefore, the estimated 80th percentile cost of office space is approximately £58.42.