Photo AI
A teacher selects a random sample of 56 students and records, to the nearest hour, the time spent watching television in a particular week - Edexcel - A-Level Maths Statistics - Question 5 - 2010 - Paper 2
Question 5
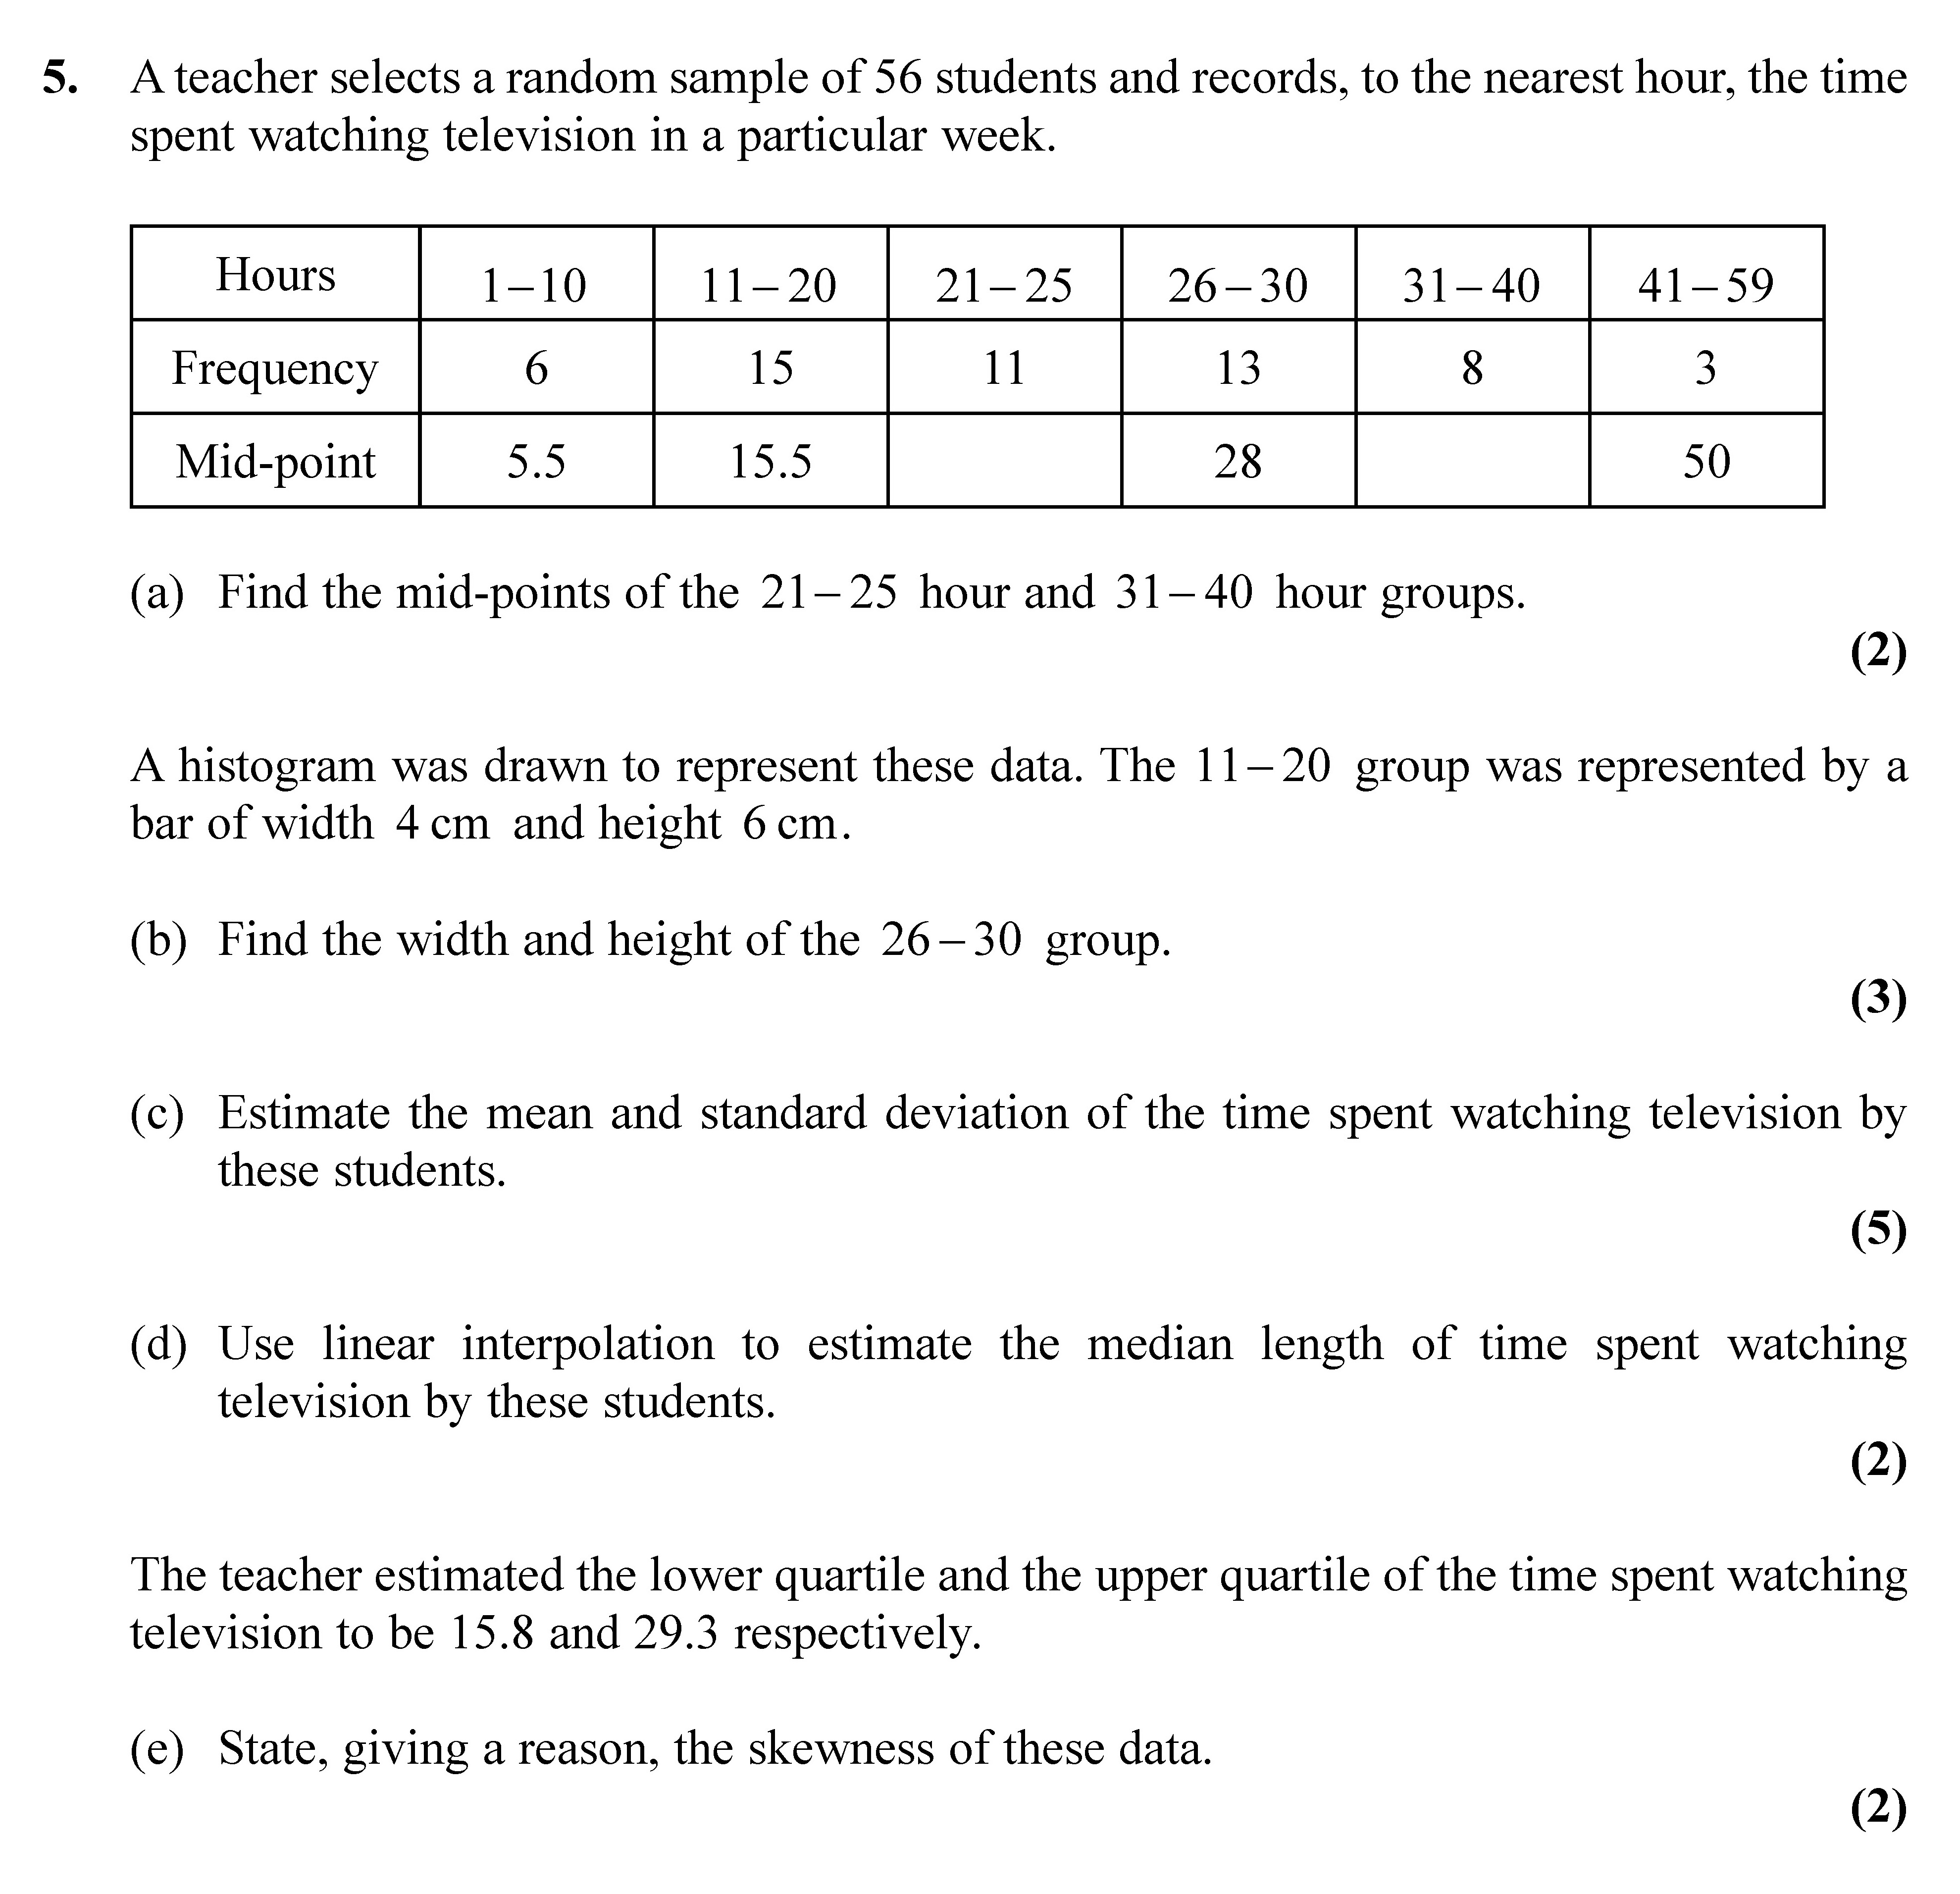
A teacher selects a random sample of 56 students and records, to the nearest hour, the time spent watching television in a particular week. | Hours | 1–10 | 11–20... show full transcript
Worked Solution & Example Answer:A teacher selects a random sample of 56 students and records, to the nearest hour, the time spent watching television in a particular week - Edexcel - A-Level Maths Statistics - Question 5 - 2010 - Paper 2
Step 1

Step 2
Find the width and height of the 26–30 group.
Answer
Given that a width of 10 units is represented by 4 cm, the width of the 26–30 group (which is 5 units) is calculated as follows:
Width for 5 units = ( \frac{4 \text{ cm}}{10} \times 5 = 2 \text{ cm} )
The height for the 26–30 group can be derived from the frequency. Since the frequency for 26–30 is 13, we can scale it depending on the height of the 11–20 group:
Height = ( \frac{6 \text{ cm}}{15} \times 13 = 5.2 \text{ cm} )
Step 3
Estimate the mean and standard deviation of the time spent watching television by these students.
Answer
To calculate the mean, we use the formula:
[ \bar{x} = \frac{\sum{(f \times x)}}{N} ]
Where:
- ( f ) is the frequency
- ( x ) is the mid-points
- ( N = 56 )
Calculating:
[ \bar{x} = \frac{(6 \times 5.5) + (15 \times 15.5) + (11 \times 23) + (13 \times 28) + (3 \times 35) + (1 \times 50)}{56} = \approx 23.5 ]
For standard deviation, we find ( \sigma ):
[ \sigma = \sqrt{\frac{\sum{f(x - \bar{x})^2}}{N}} ]
On calculation, this gives: ( \sigma \approx 10.8 )
Step 4
Use linear interpolation to estimate the median length of time spent watching television by these students.
Answer
The median can be estimated using the cumulative frequency. The median class is determined by locating the 28th student. For the 26-30 group (with a frequency of 13) in the cumulative frequency, we can assert:
[ Q_2 = L + \left(\frac{\frac{N}{2} - CF}{f}\right) \times c ]
Where:
- L is the lower boundary of the median class = 25.5
- CF is the cumulative frequency before the median class = 25
- f is the frequency of the median class = 13
- c is the class width = 5
Calculating this gives: ( Q_2 \approx 26.3 ).
Step 5
State, giving a reason, the skewness of these data.
Answer
Given that the lower quartile (15.8) and upper quartile (29.3) indicate a significant spread, and since the median (26.3) is closer to the upper quartile, we can conclude that these data are negatively skewed. This is evidenced by the longer tail on the left side of the distribution.