Photo AI
The histogram in Figure 1 shows the time, to the nearest minute, that a random sample of 100 motorists were delayed by roadworks on a stretch of motorway - Edexcel - A-Level Maths Statistics - Question 1 - 2012 - Paper 1
Question 1
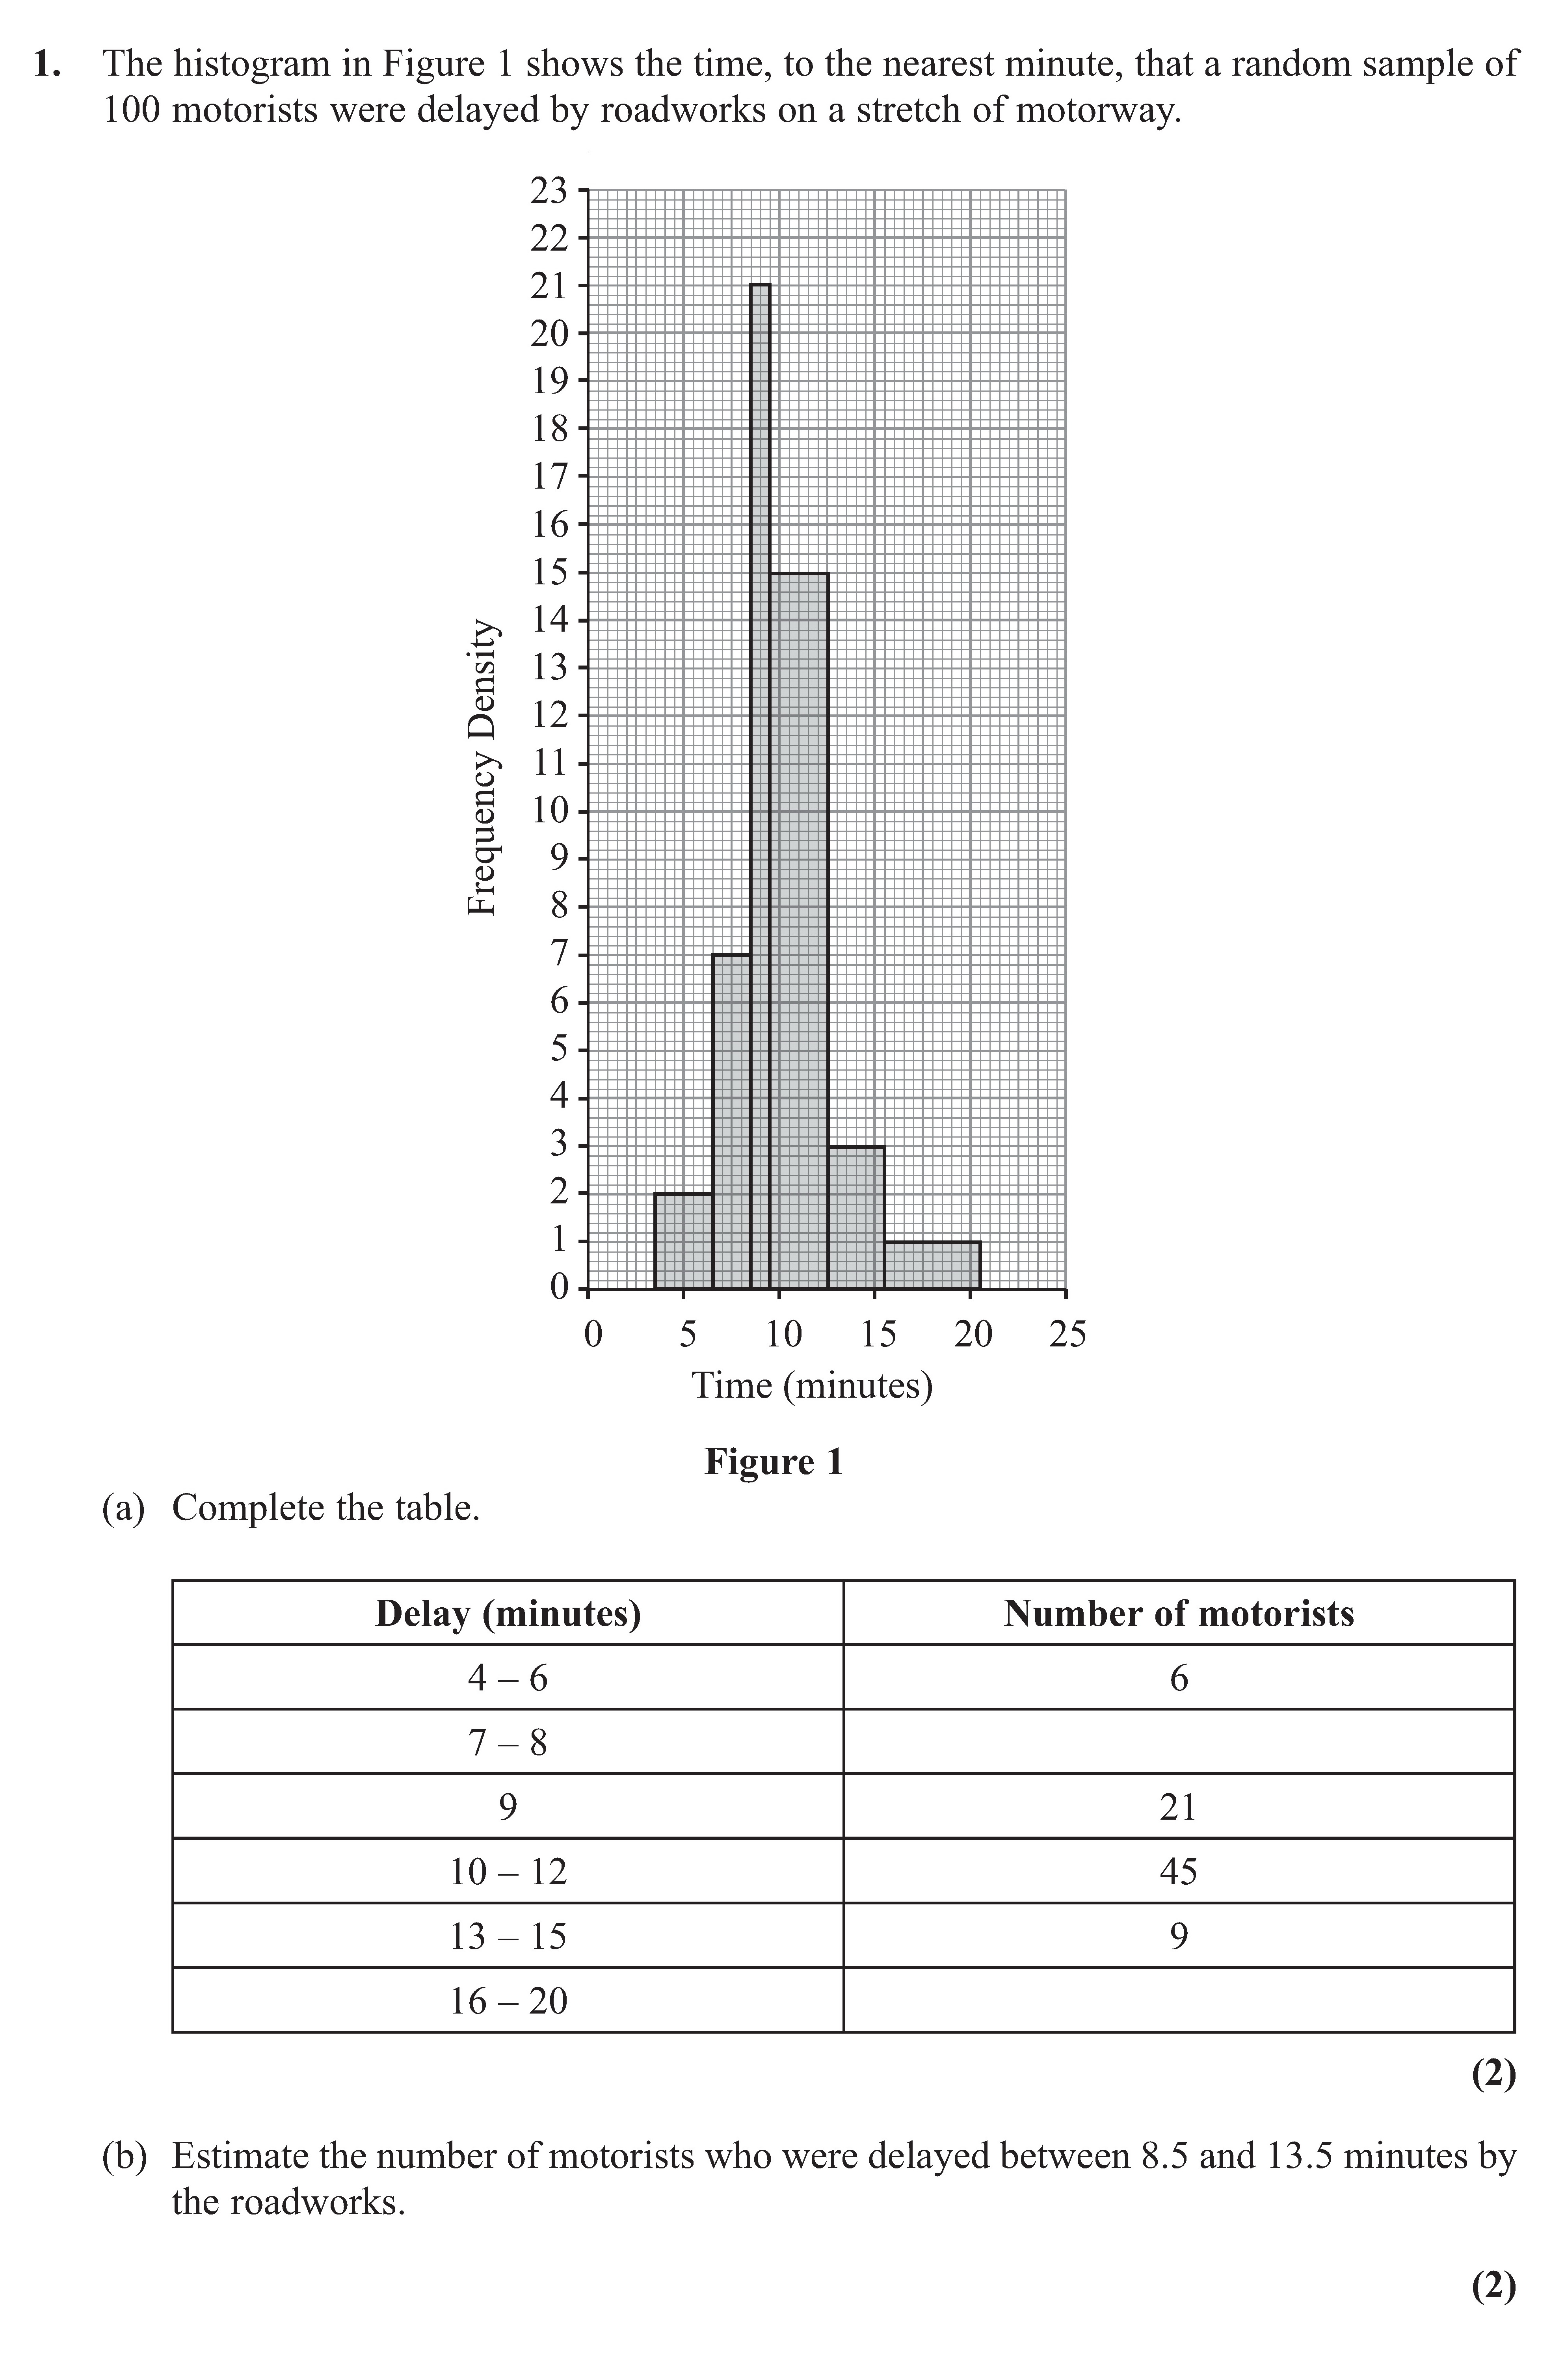
The histogram in Figure 1 shows the time, to the nearest minute, that a random sample of 100 motorists were delayed by roadworks on a stretch of motorway. (a) Compl... show full transcript
Worked Solution & Example Answer:The histogram in Figure 1 shows the time, to the nearest minute, that a random sample of 100 motorists were delayed by roadworks on a stretch of motorway - Edexcel - A-Level Maths Statistics - Question 1 - 2012 - Paper 1
Step 1
Complete the table.

Answer
To complete the table, we first find the missing values from the histogram. The histogram indicates the number of motorists delayed in the following time intervals:
- For the delay 4 – 6 minutes, the number of motorists is 6, as given.
- For the delay 7 – 8 minutes, it appears there are 14 motorists, which can be visually assessed from the histogram.
- For the delay of 9 minutes, the number of motorists is already specified as 21.
- For the delay interval of 10 – 12 minutes, the histogram shows 45 motorists.
- For the delay of 13 – 15 minutes, 9 motorists are noted.
- Finally, for the delay interval of 16 – 20 minutes, we estimate 5 motorists, based on the histogram pattern. This brings us to the completed table:
| Delay (minutes) | Number of motorists |
|---|---|
| 4 – 6 | 6 |
| 7 – 8 | 14 |
| 9 | 21 |
| 10 – 12 | 45 |
| 13 – 15 | 9 |
| 16 – 20 | 5 |
Step 2
Estimate the number of motorists who were delayed between 8.5 and 13.5 minutes by the roadworks.
Answer
To estimate the number of motorists delayed between 8.5 and 13.5 minutes:
- From the table completed in part (a), we first find the number of motorists between 8.5 to 9.0 minutes. Referring to the histogram, this section can be approximated to around half of the total for the 9-minute delay, which is about 10 motorists.
- Then we consider the interval from 9.0 to 10.0 minutes (which is fully included), corresponding to the given 21 motorists.
- Next, we have the interval from 10.0 to 12.0 minutes, consisting of 45 motorists (fully included).
- Lastly, we look at the interval from 12.0 to 13.5 minutes; we can estimate half of 9 motorists for this interval, yielding approximately 4 or 5 motorists.
Summing these estimates gives:
- 10 (from 8.5 to 9)
- 21 (from 9 to 10)
- 45 (from 10 to 12)
- About 4 or 5 (from 12 to 13.5)
Thus, the total estimated number of motorists delayed between 8.5 and 13.5 minutes is approximately:
Therefore, we estimate approximately 81 motorists were delayed.