Photo AI
Figure 15 shows the changes in the levels of the hormones of the menstrual cycle - Edexcel - GCSE Biology - Question 8 - 2023 - Paper 2
Question 8
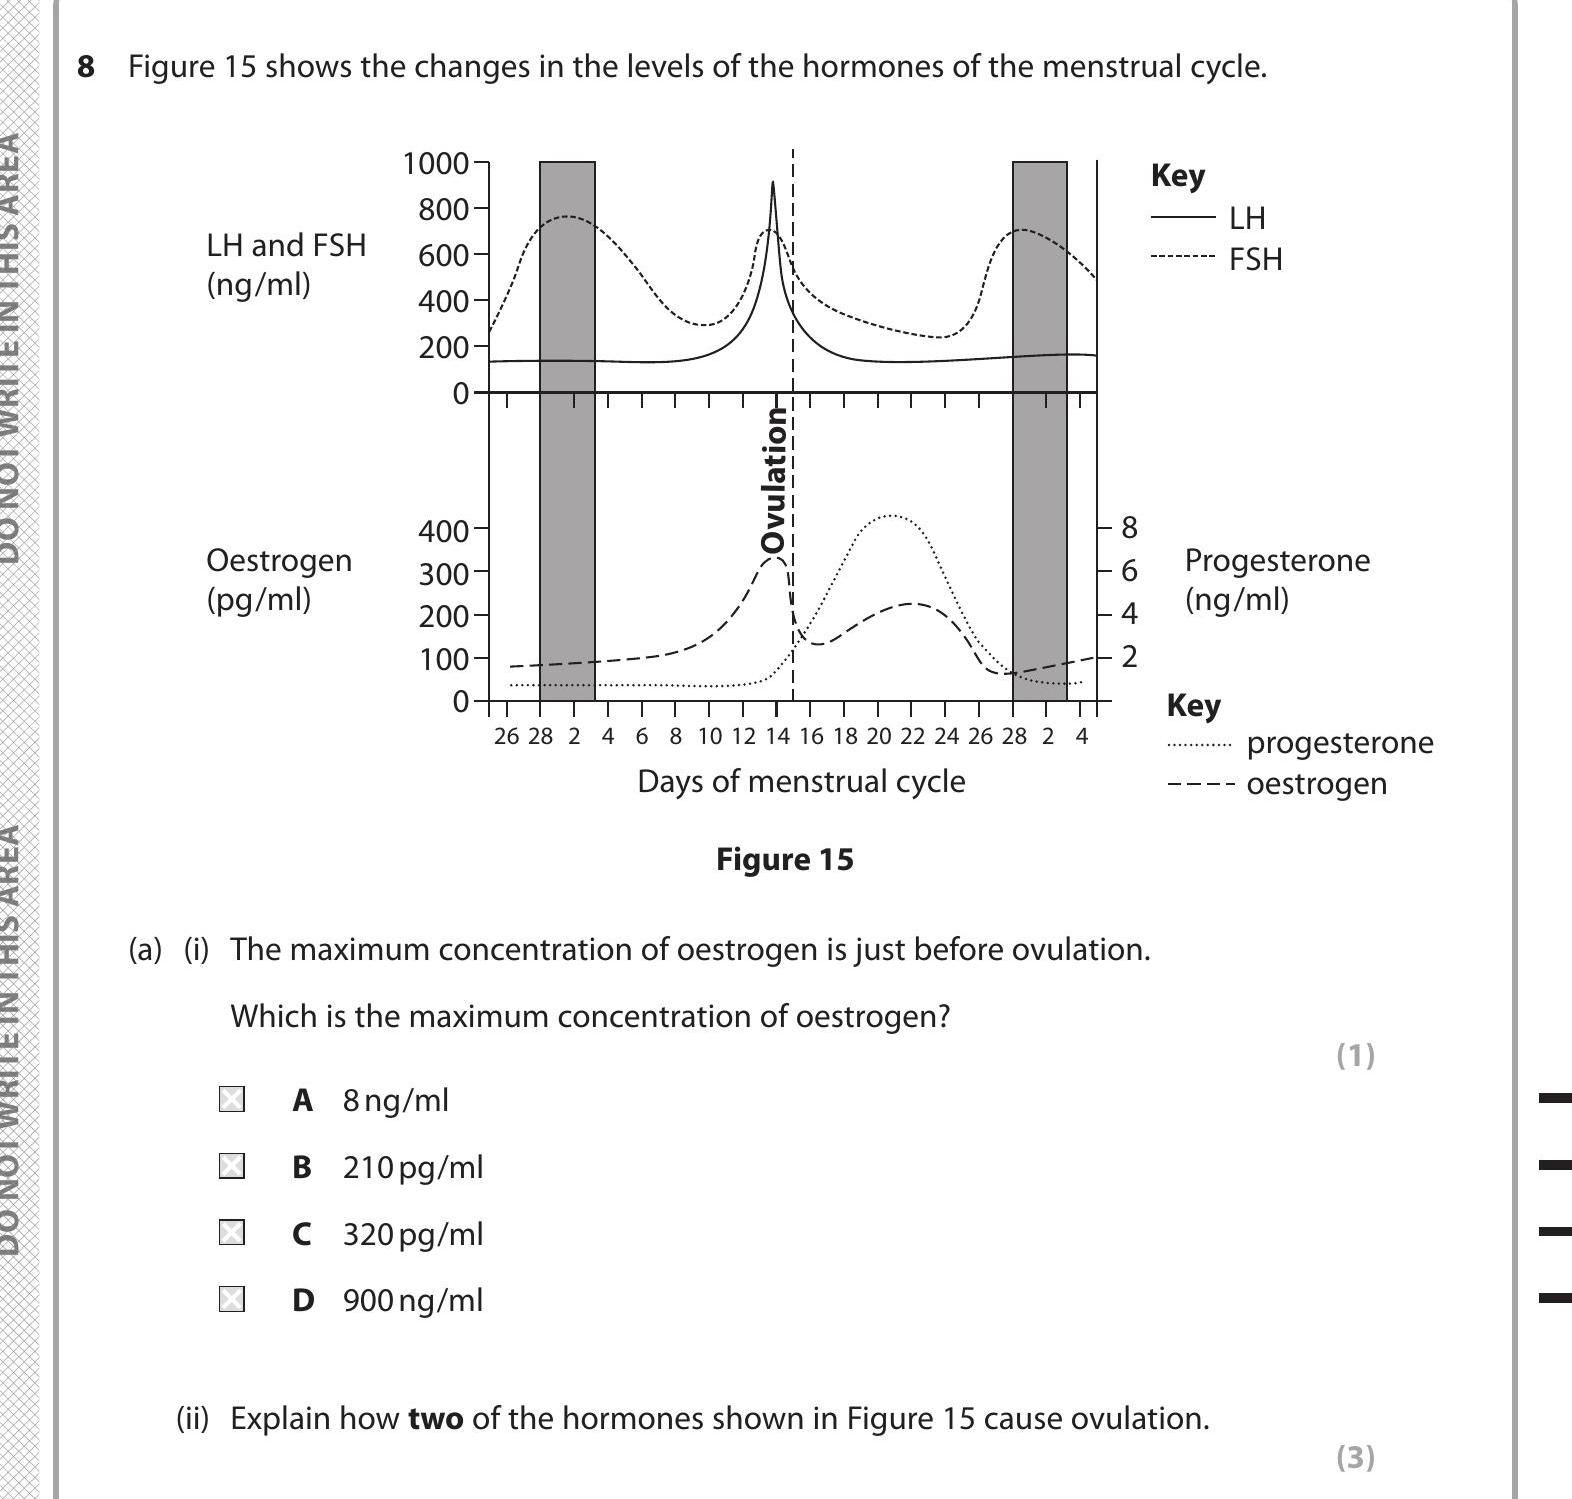
Figure 15 shows the changes in the levels of the hormones of the menstrual cycle. (a) (i) The maximum concentration of oestrogen is just before ovulation. Which is... show full transcript
Worked Solution & Example Answer:Figure 15 shows the changes in the levels of the hormones of the menstrual cycle - Edexcel - GCSE Biology - Question 8 - 2023 - Paper 2
Step 1

Step 2
Explain how two of the hormones shown in Figure 15 cause ovulation.
Answer
-
Luteinizing Hormone (LH): LH plays a crucial role in triggering ovulation. As oestrogen levels rise, they stimulate a surge in LH. This surge induces the maturation of the egg and leads to its release from the ovary, which is the event known as ovulation.
-
Follicle-Stimulating Hormone (FSH): FSH contributes to the growth and maturation of ovarian follicles. Increased levels of FSH facilitate the development of the follicles in the ovaries, which produce oestrogen. This oestrogen then helps initiate the LH surge necessary for ovulation.