Photo AI
The student investigated the rate by using different sizes of marble chips - Edexcel - GCSE Chemistry Combined Science - Question 8 - 2016 - Paper 1
Question 8
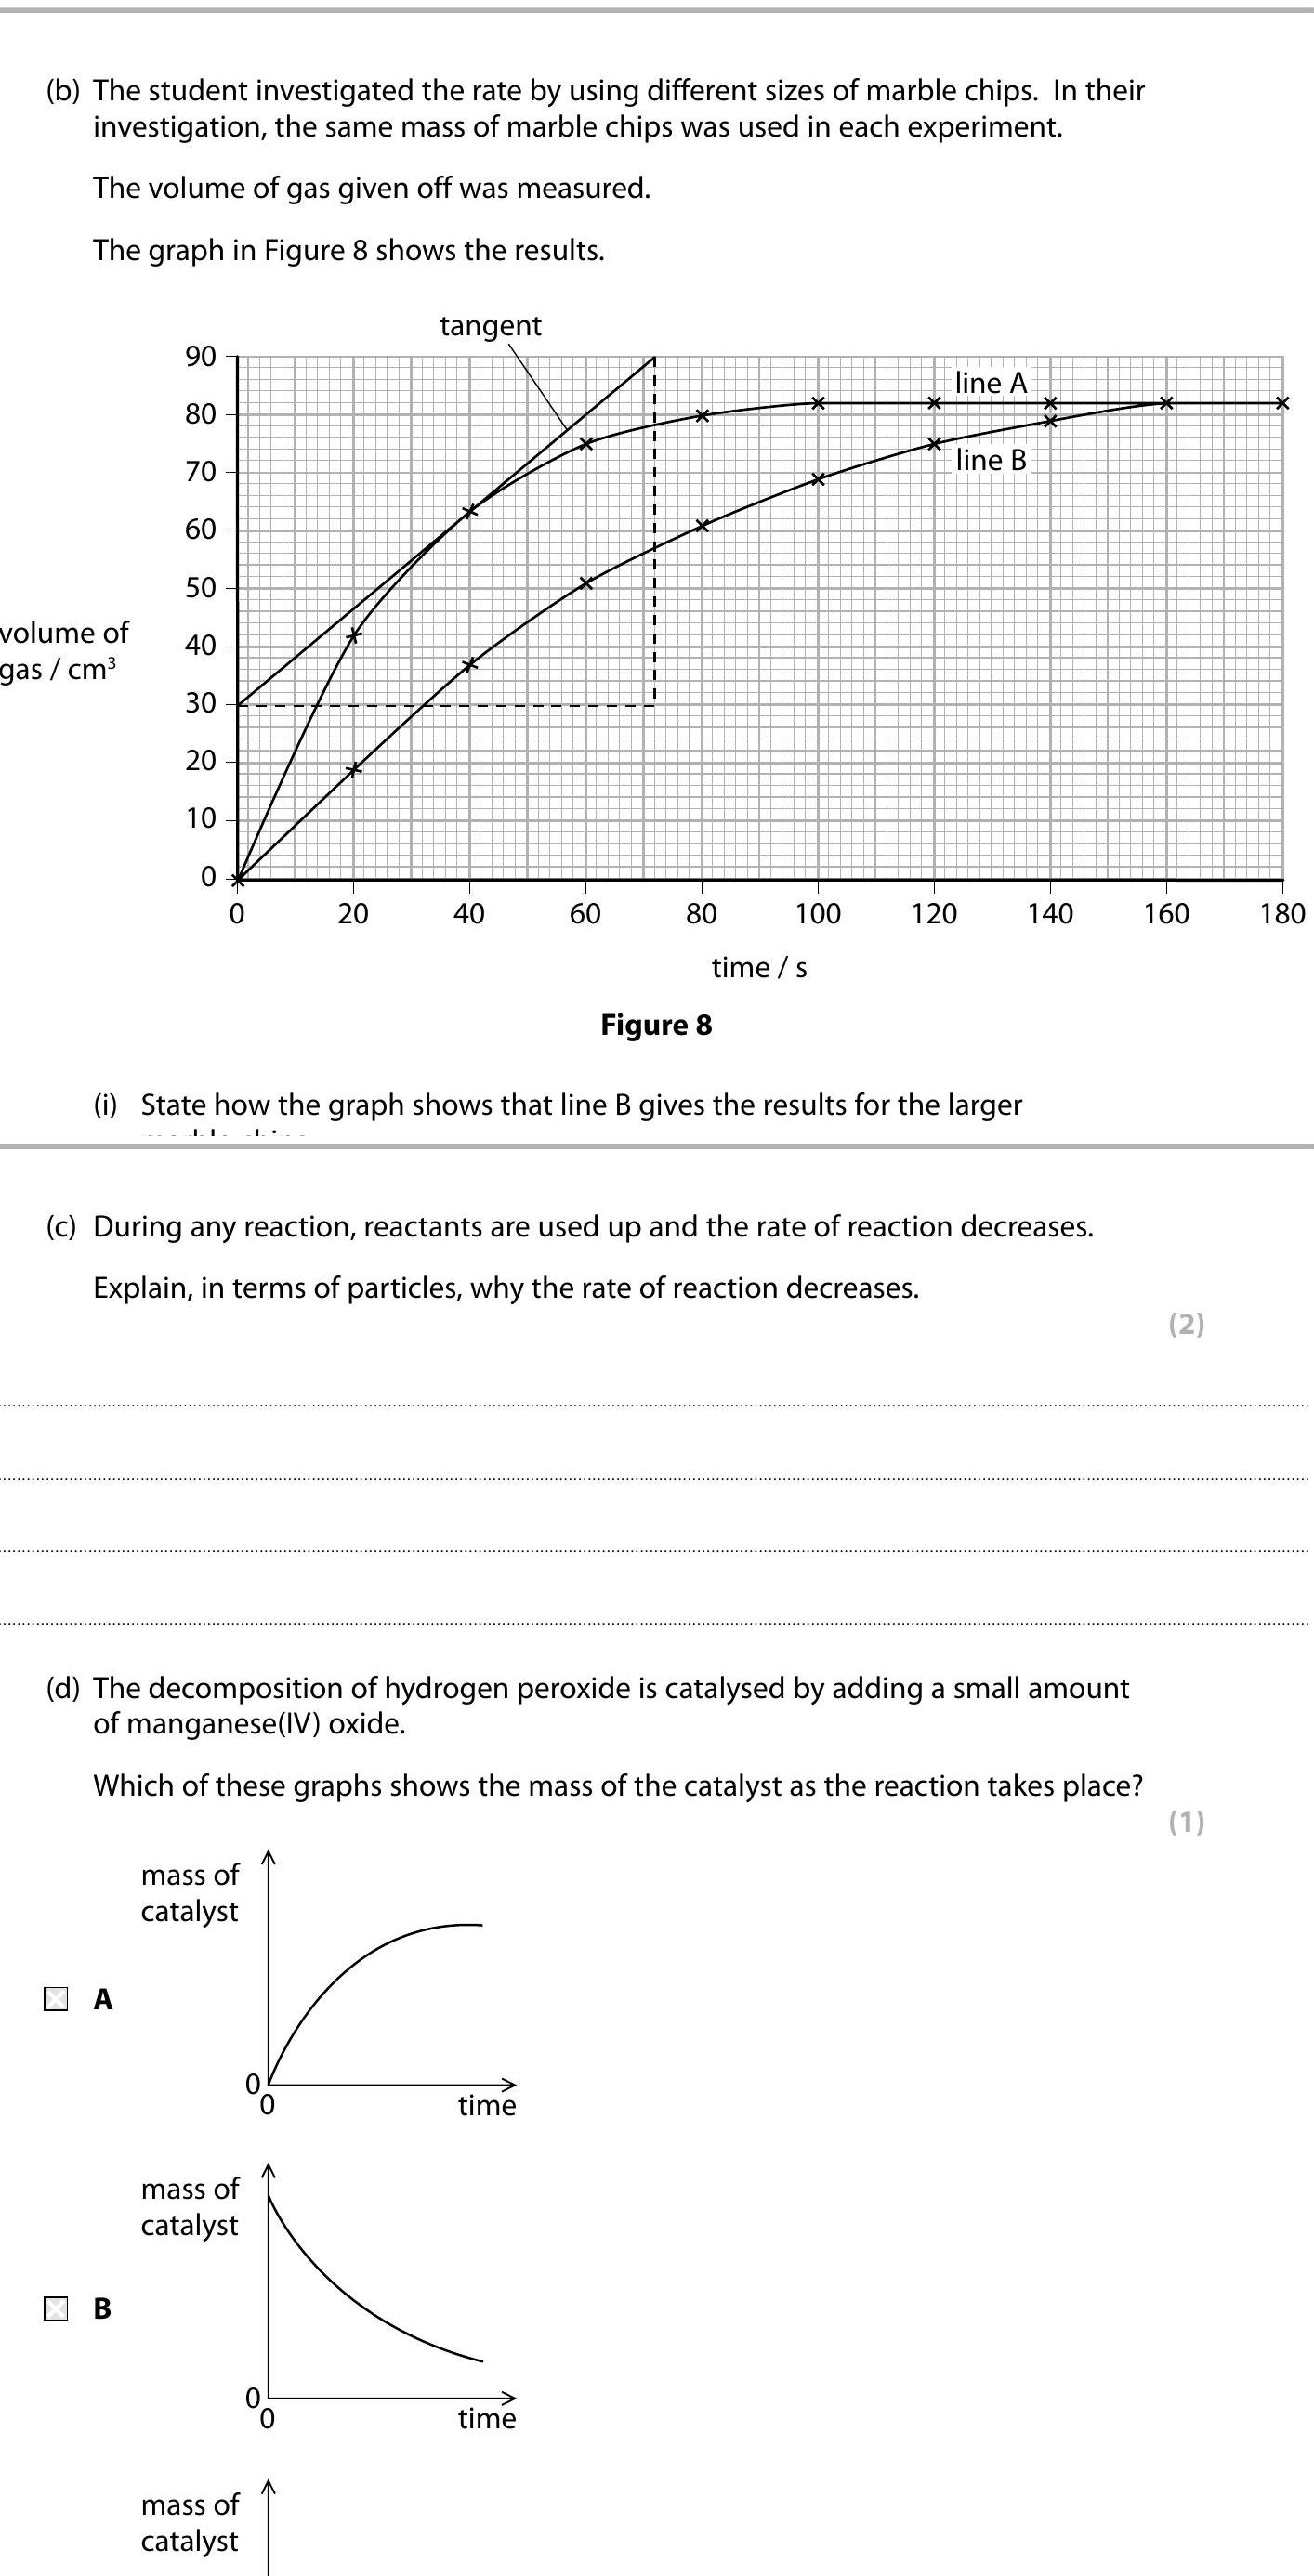
The student investigated the rate by using different sizes of marble chips. In their investigation, the same mass of marble chips was used in each experiment. The vo... show full transcript
Worked Solution & Example Answer:The student investigated the rate by using different sizes of marble chips - Edexcel - GCSE Chemistry Combined Science - Question 8 - 2016 - Paper 1
Step 1
State how the graph shows that line B gives the results for the larger...

Answer
Line B illustrates a consistent increase in gas volume as time progresses, indicating that the reaction rate is higher compared to line A. The graph shows a steeper slope for line B during the initial time intervals, suggesting that more gas is produced in a shorter amount of time with the larger marble chips, thereby confirming that line B gives results for a faster reaction.
Step 2
Explain, in terms of particles, why the rate of reaction decreases.
Answer
As the reaction proceeds, the concentration of reactants decreases since they are being converted into products. With fewer reactant particles available, the chances of effective collisions between particles also diminish. This results in a lower frequency of successful collisions, leading to a decreased rate of reaction over time. Additionally, as products accumulate, they may inhibit the reaction by occupying space and reducing active sites for further reactions.
Step 3
Which of these graphs shows the mass of the catalyst as the reaction takes place?
Answer
Graph A is the correct representation. It shows that the mass of the catalyst remains consistent over time, indicating that the catalyst is not consumed during the reaction but rather facilitates the decomposition process without a reduction in its total mass.