Photo AI
The diagram shows part of the graph of $y = x^2 - 2x + 3$ (a) By drawing a suitable straight line, use your graph to find estimates for the solutions of $x^2 - 3x - 1 = 0$ - Edexcel - GCSE Maths - Question 20 - 2017 - Paper 2
Question 20
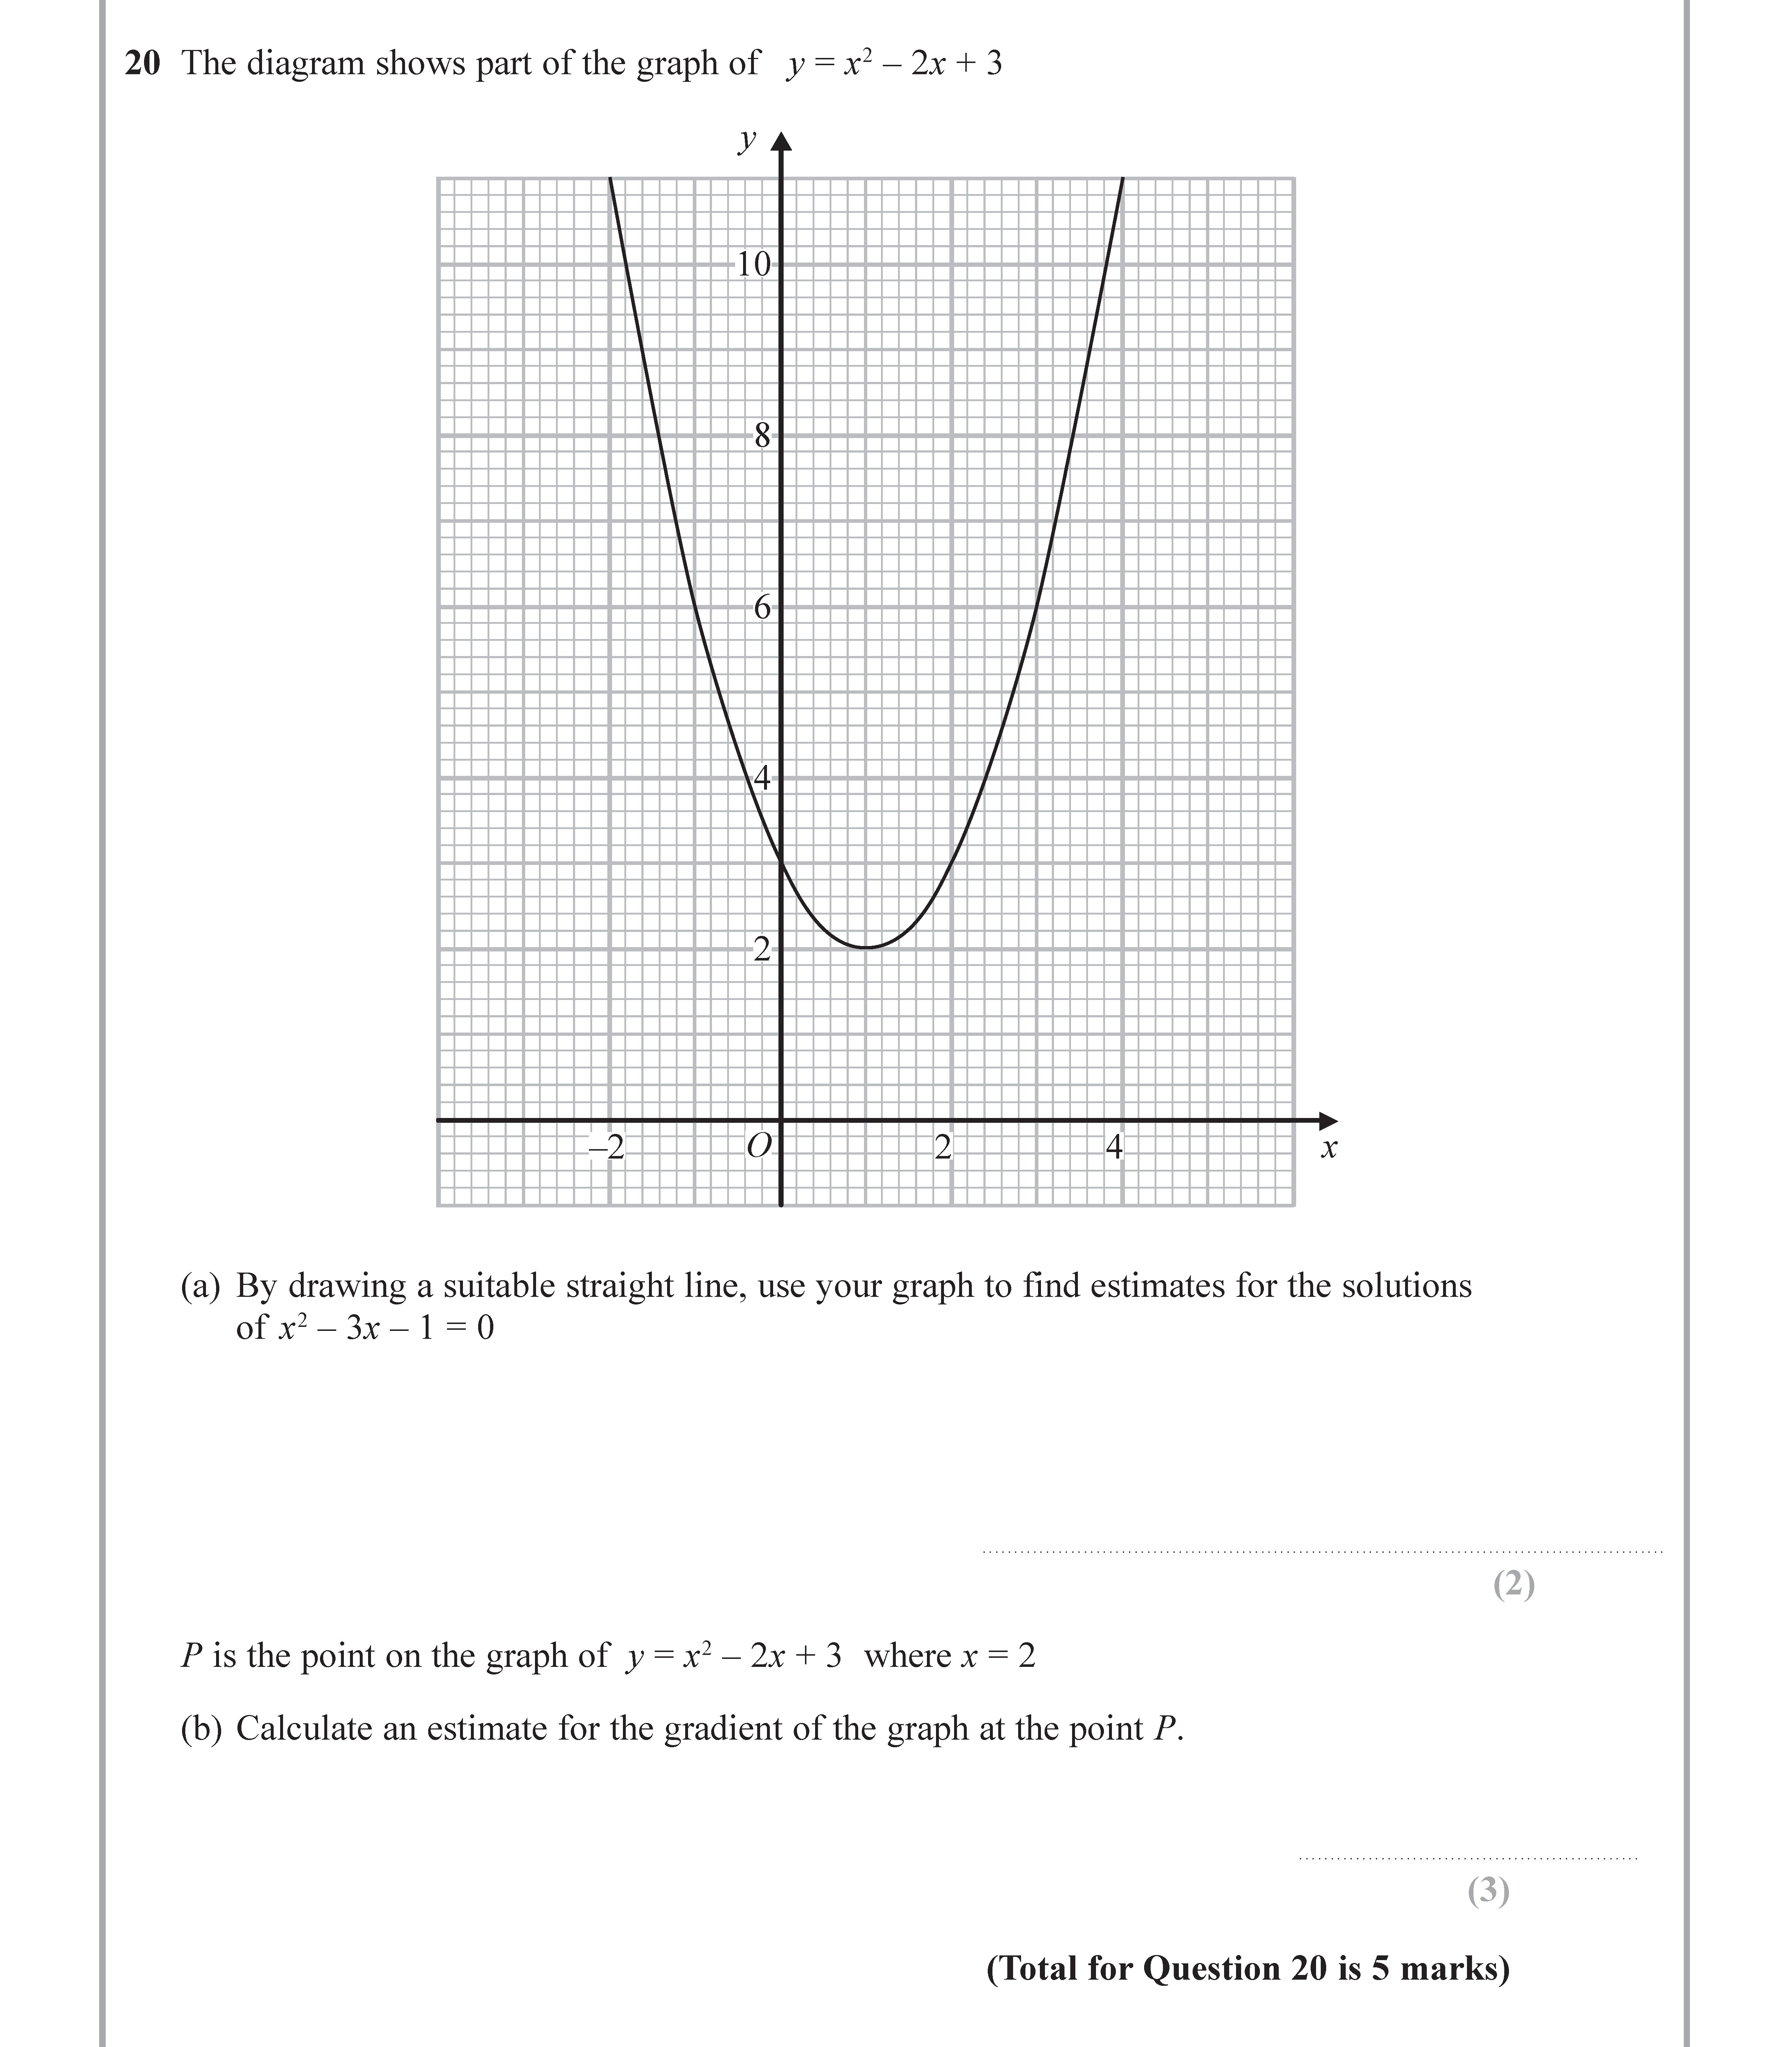
The diagram shows part of the graph of $y = x^2 - 2x + 3$ (a) By drawing a suitable straight line, use your graph to find estimates for the solutions of $x^2 -... show full transcript
Worked Solution & Example Answer:The diagram shows part of the graph of $y = x^2 - 2x + 3$ (a) By drawing a suitable straight line, use your graph to find estimates for the solutions of $x^2 - 3x - 1 = 0$ - Edexcel - GCSE Maths - Question 20 - 2017 - Paper 2
Step 1
By drawing a suitable straight line, use your graph to find estimates for the solutions of $x^2 - 3x - 1 = 0$

Answer
To find the solutions for the equation , we need to graph the equation alongside .
-
Rearrange the equation:
-
Plot this equation on the same graph as .
-
The points where the two graphs intersect represent the solutions to the equation.
-
Upon visual inspection, we find estimates of the x-values where the intersection occurs. We can get approximate solutions in the range:
- .
Step 2
Calculate an estimate for the gradient of the graph at the point $P$
Answer
To calculate the gradient at the point , where , we need to find the derivative of the function:
-
The function is:
-
Find the derivative:
-
Substitute into the derivative:
-
Therefore, the estimate for the gradient at point is in the range:
- to .