Photo AI
Here is a speed-time graph - Edexcel - GCSE Maths - Question 15 - 2022 - Paper 1
Question 15
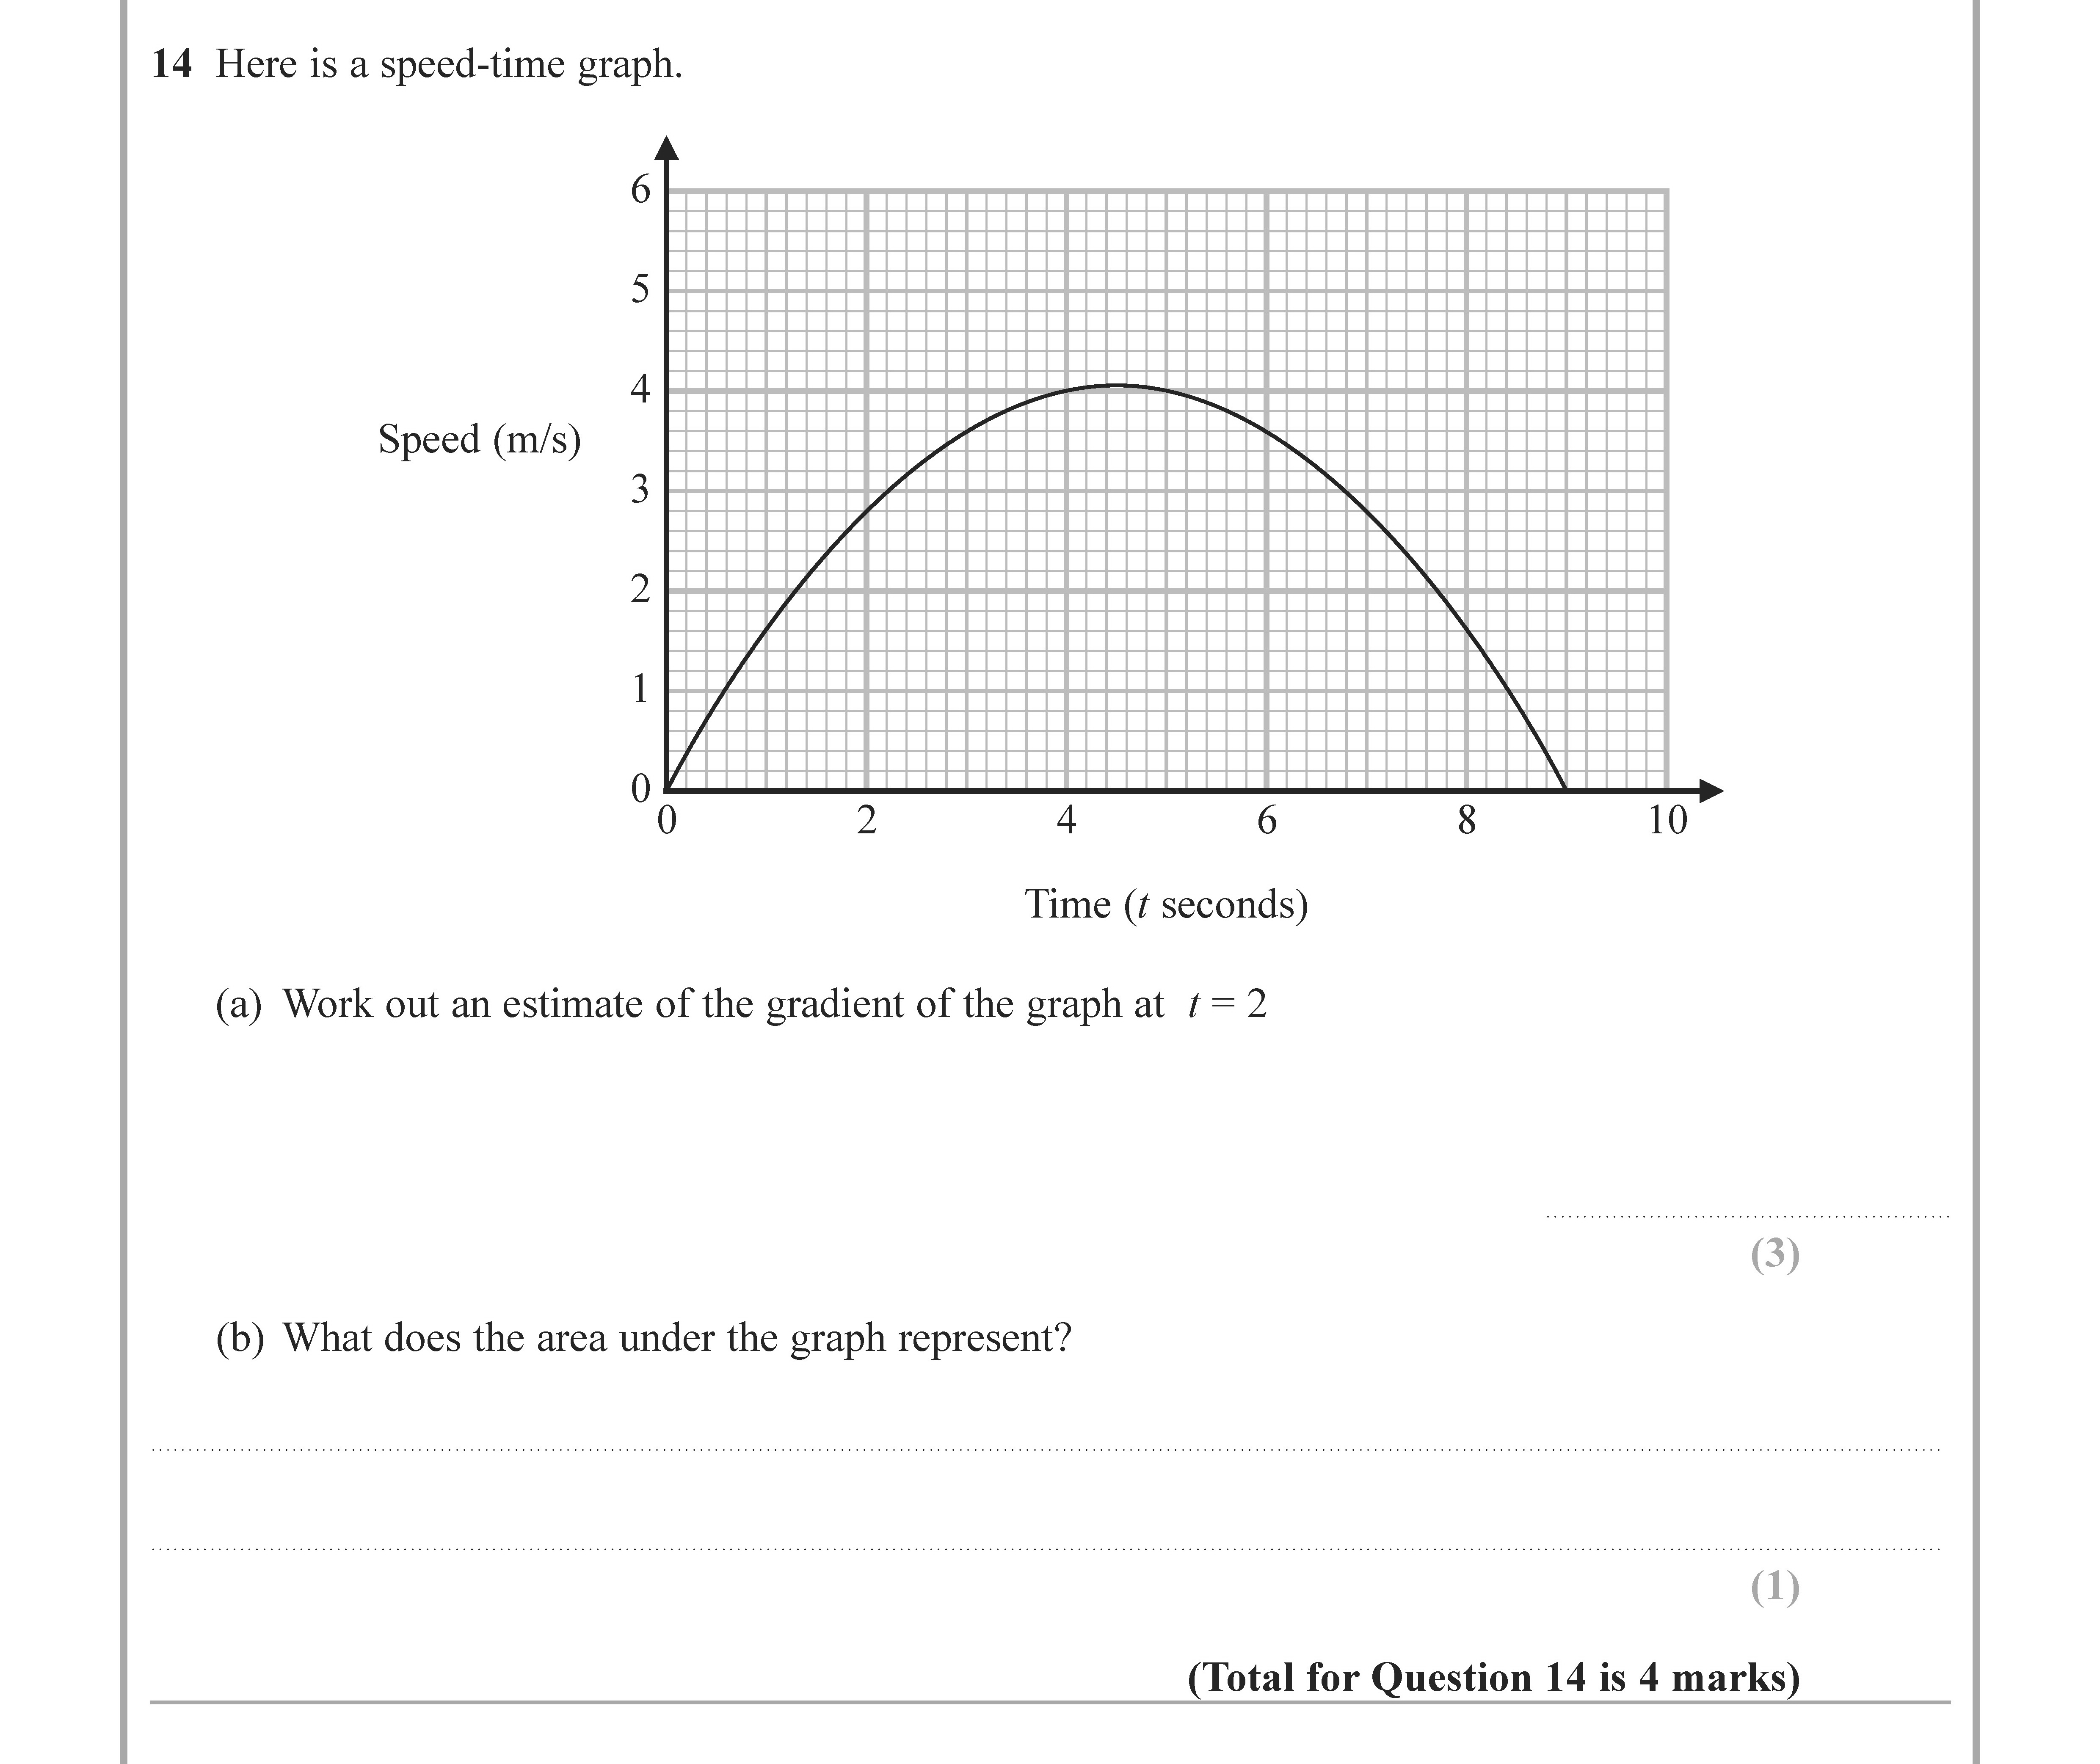
Here is a speed-time graph. (a) Work out an estimate of the gradient of the graph at t = 2. (b) What does the area under the graph represent?
Worked Solution & Example Answer:Here is a speed-time graph - Edexcel - GCSE Maths - Question 15 - 2022 - Paper 1
Step 1
Work out an estimate of the gradient of the graph at t = 2.

Answer
To find the gradient of the speed-time graph at t = 2 seconds, we need to draw a tangent line at this point.
Looking at the graph, we can estimate the rise and run of the tangent line:
- At t = 2 seconds, the speed is approximately 5 m/s.
- By observing the graph, we estimate another point on the tangent line near t = 0 seconds where the speed is around 2 m/s.
Now, we can find the gradient using the formula:
ext{Gradient} = rac{ ext{Change in Speed}}{ ext{Change in Time}} = rac{5 - 2}{2 - 0} = rac{3}{2} = 1.5 ext{ m/s}^2Therefore, the estimated gradient at t = 2 seconds is approximately 1.5 m/s².
Step 2
What does the area under the graph represent?
Answer
The area under the speed-time graph represents the total distance traveled during the time interval. In this context, the area can be calculated by summing up the shapes formed under the graph within the specified time frame. Therefore, if the area is calculated, it would give us a numerical value indicating the total distance covered by the object in motion.