Photo AI
The cumulative frequency graph shows some information about the heights, in cm, of 60 students - Edexcel - GCSE Maths - Question 8 - 2017 - Paper 2
Question 8
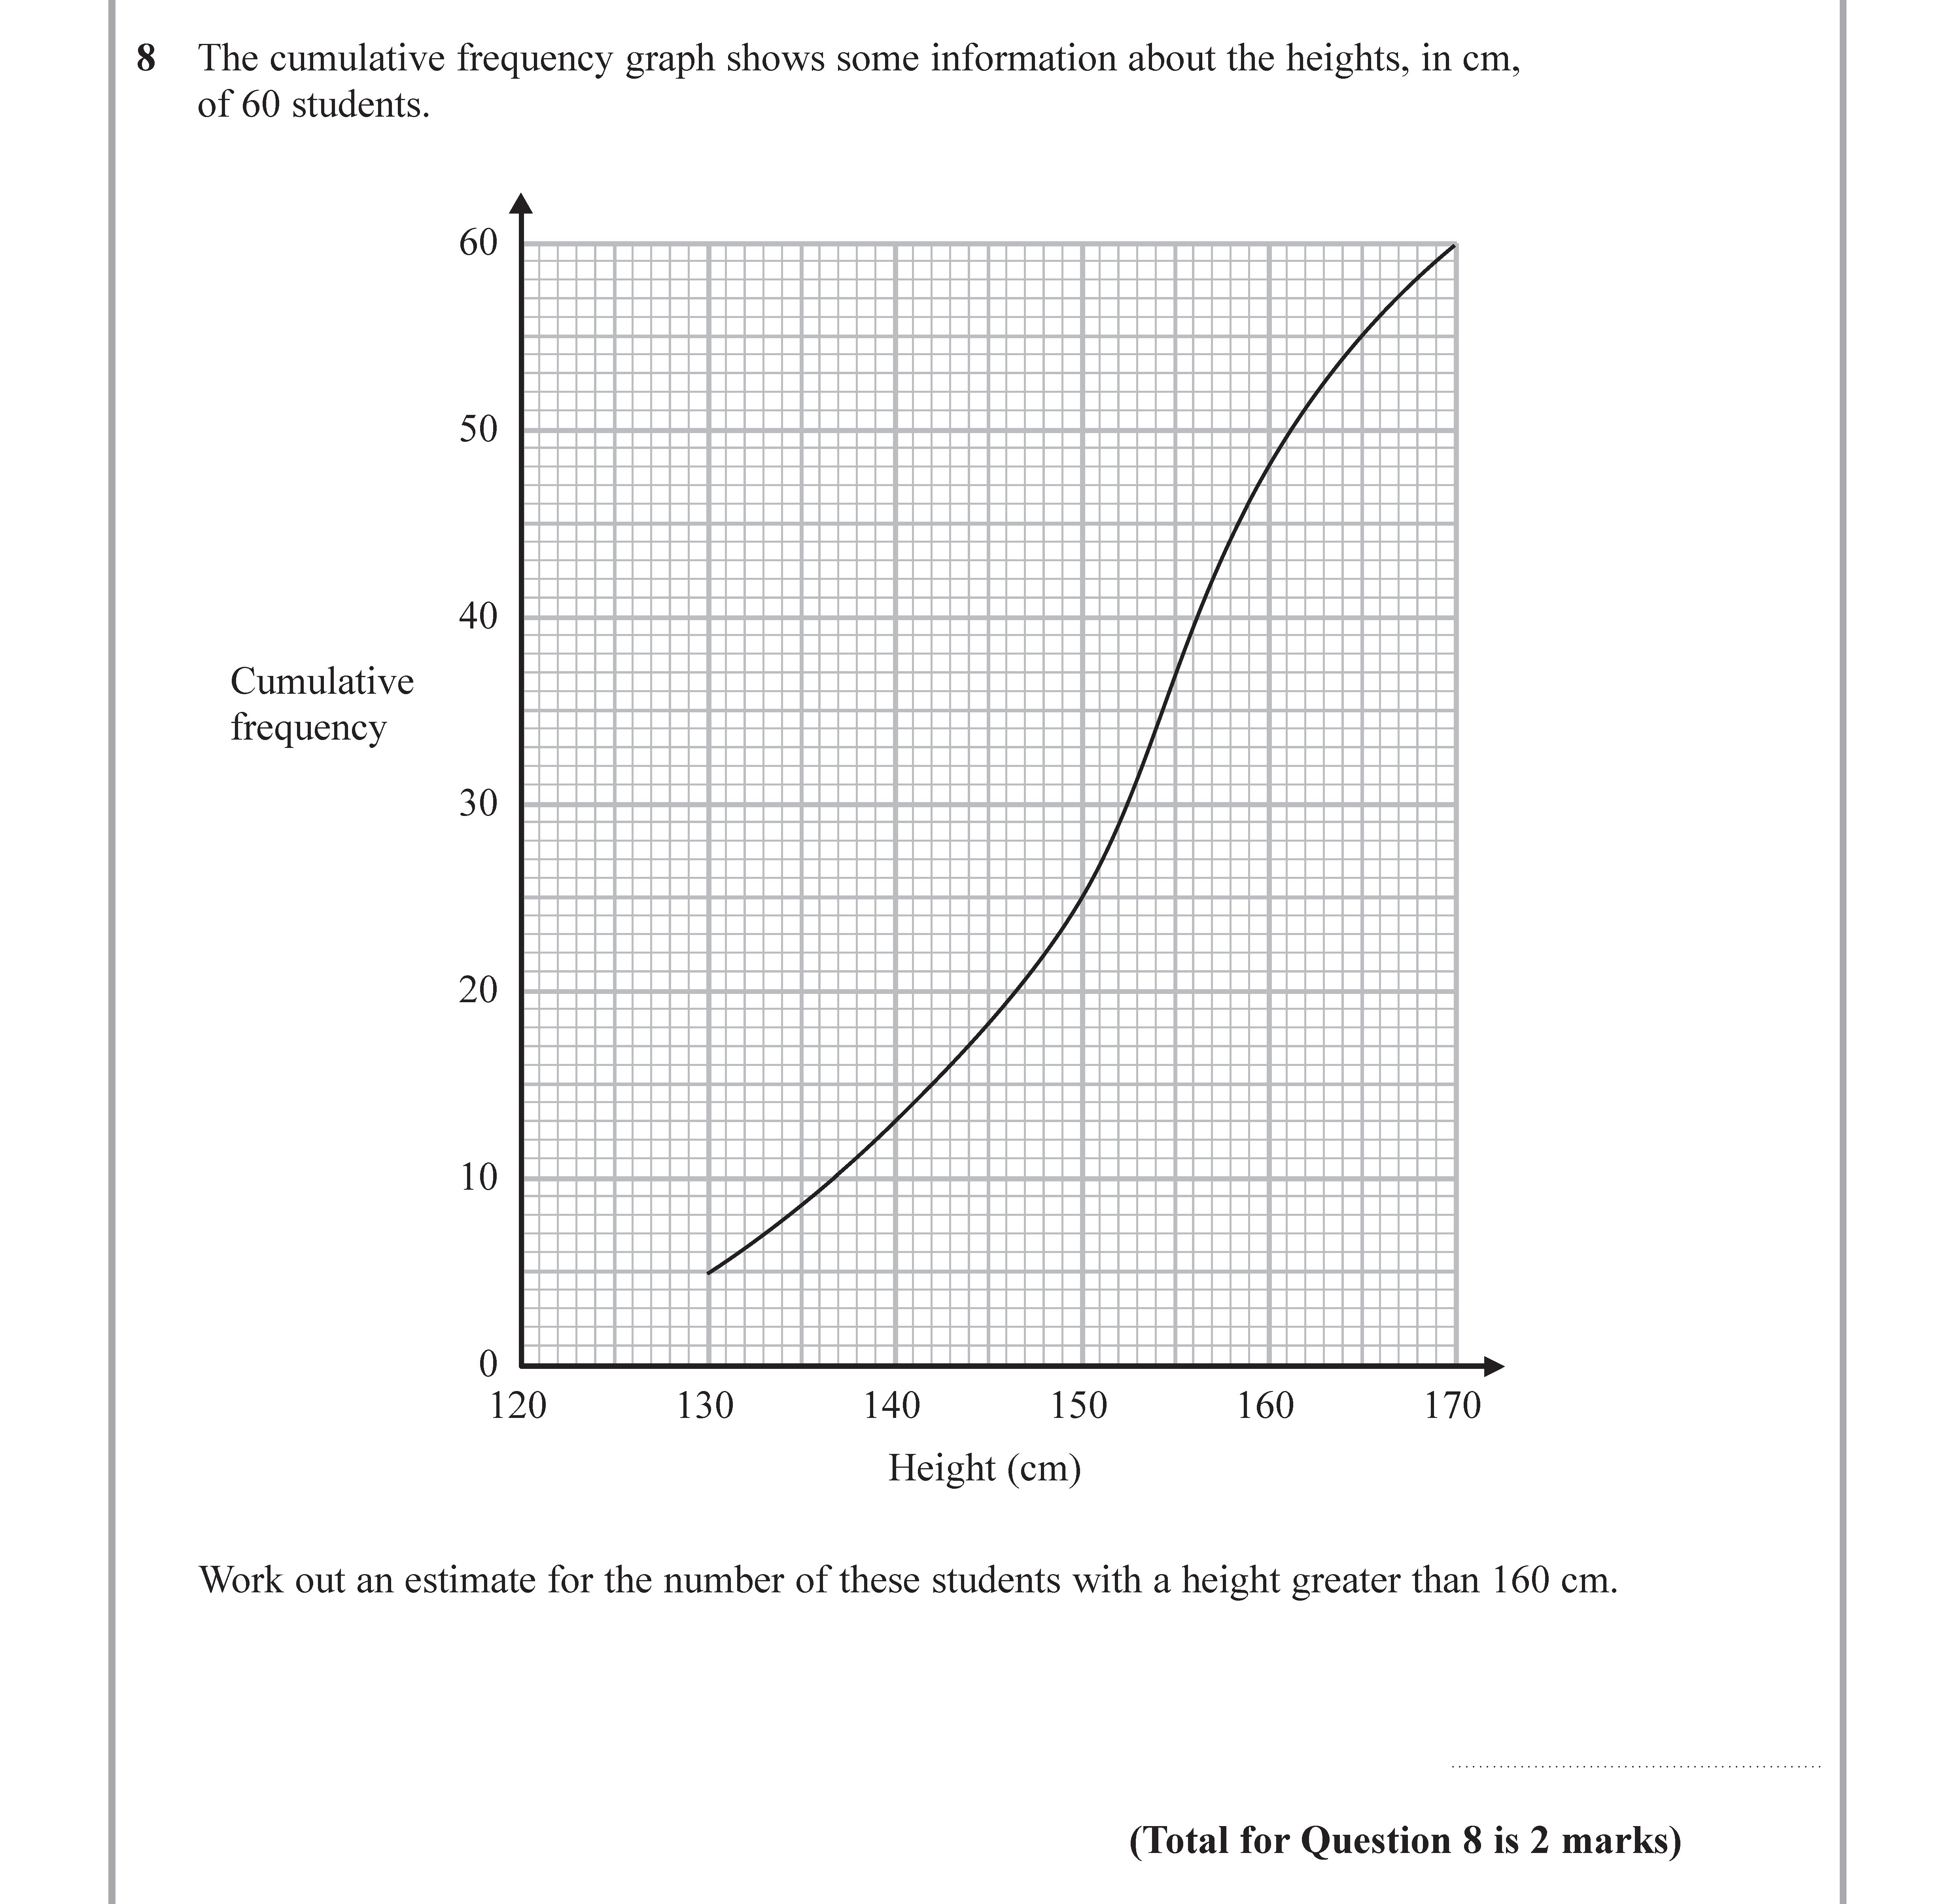
The cumulative frequency graph shows some information about the heights, in cm, of 60 students. Work out an estimate for the number of these students with a height ... show full transcript
Worked Solution & Example Answer:The cumulative frequency graph shows some information about the heights, in cm, of 60 students - Edexcel - GCSE Maths - Question 8 - 2017 - Paper 2
Step 1
Estimate the cumulative frequency at 160 cm

Answer
To find the cumulative frequency for students whose height is less than or equal to 160 cm, locate 160 cm on the horizontal axis of the graph. Trace a vertical line upwards until it intersects the curve. From this intersection, draw a horizontal line to the vertical axis to read the corresponding cumulative frequency. For our case, this intersects at approximately 50.
Step 2
Calculate the number of students with height greater than 160 cm
Answer
Since the total number of students is 60, we can find the number of students greater than 160 cm by subtracting the cumulative frequency at 160 cm from the total number of students:
Thus, an estimate for the number of students with height greater than 160 cm is 10.