The graph of $y = f(x)$ is shown on the grid below - Edexcel - GCSE Maths - Question 19 - 2018 - Paper 1
Question 19
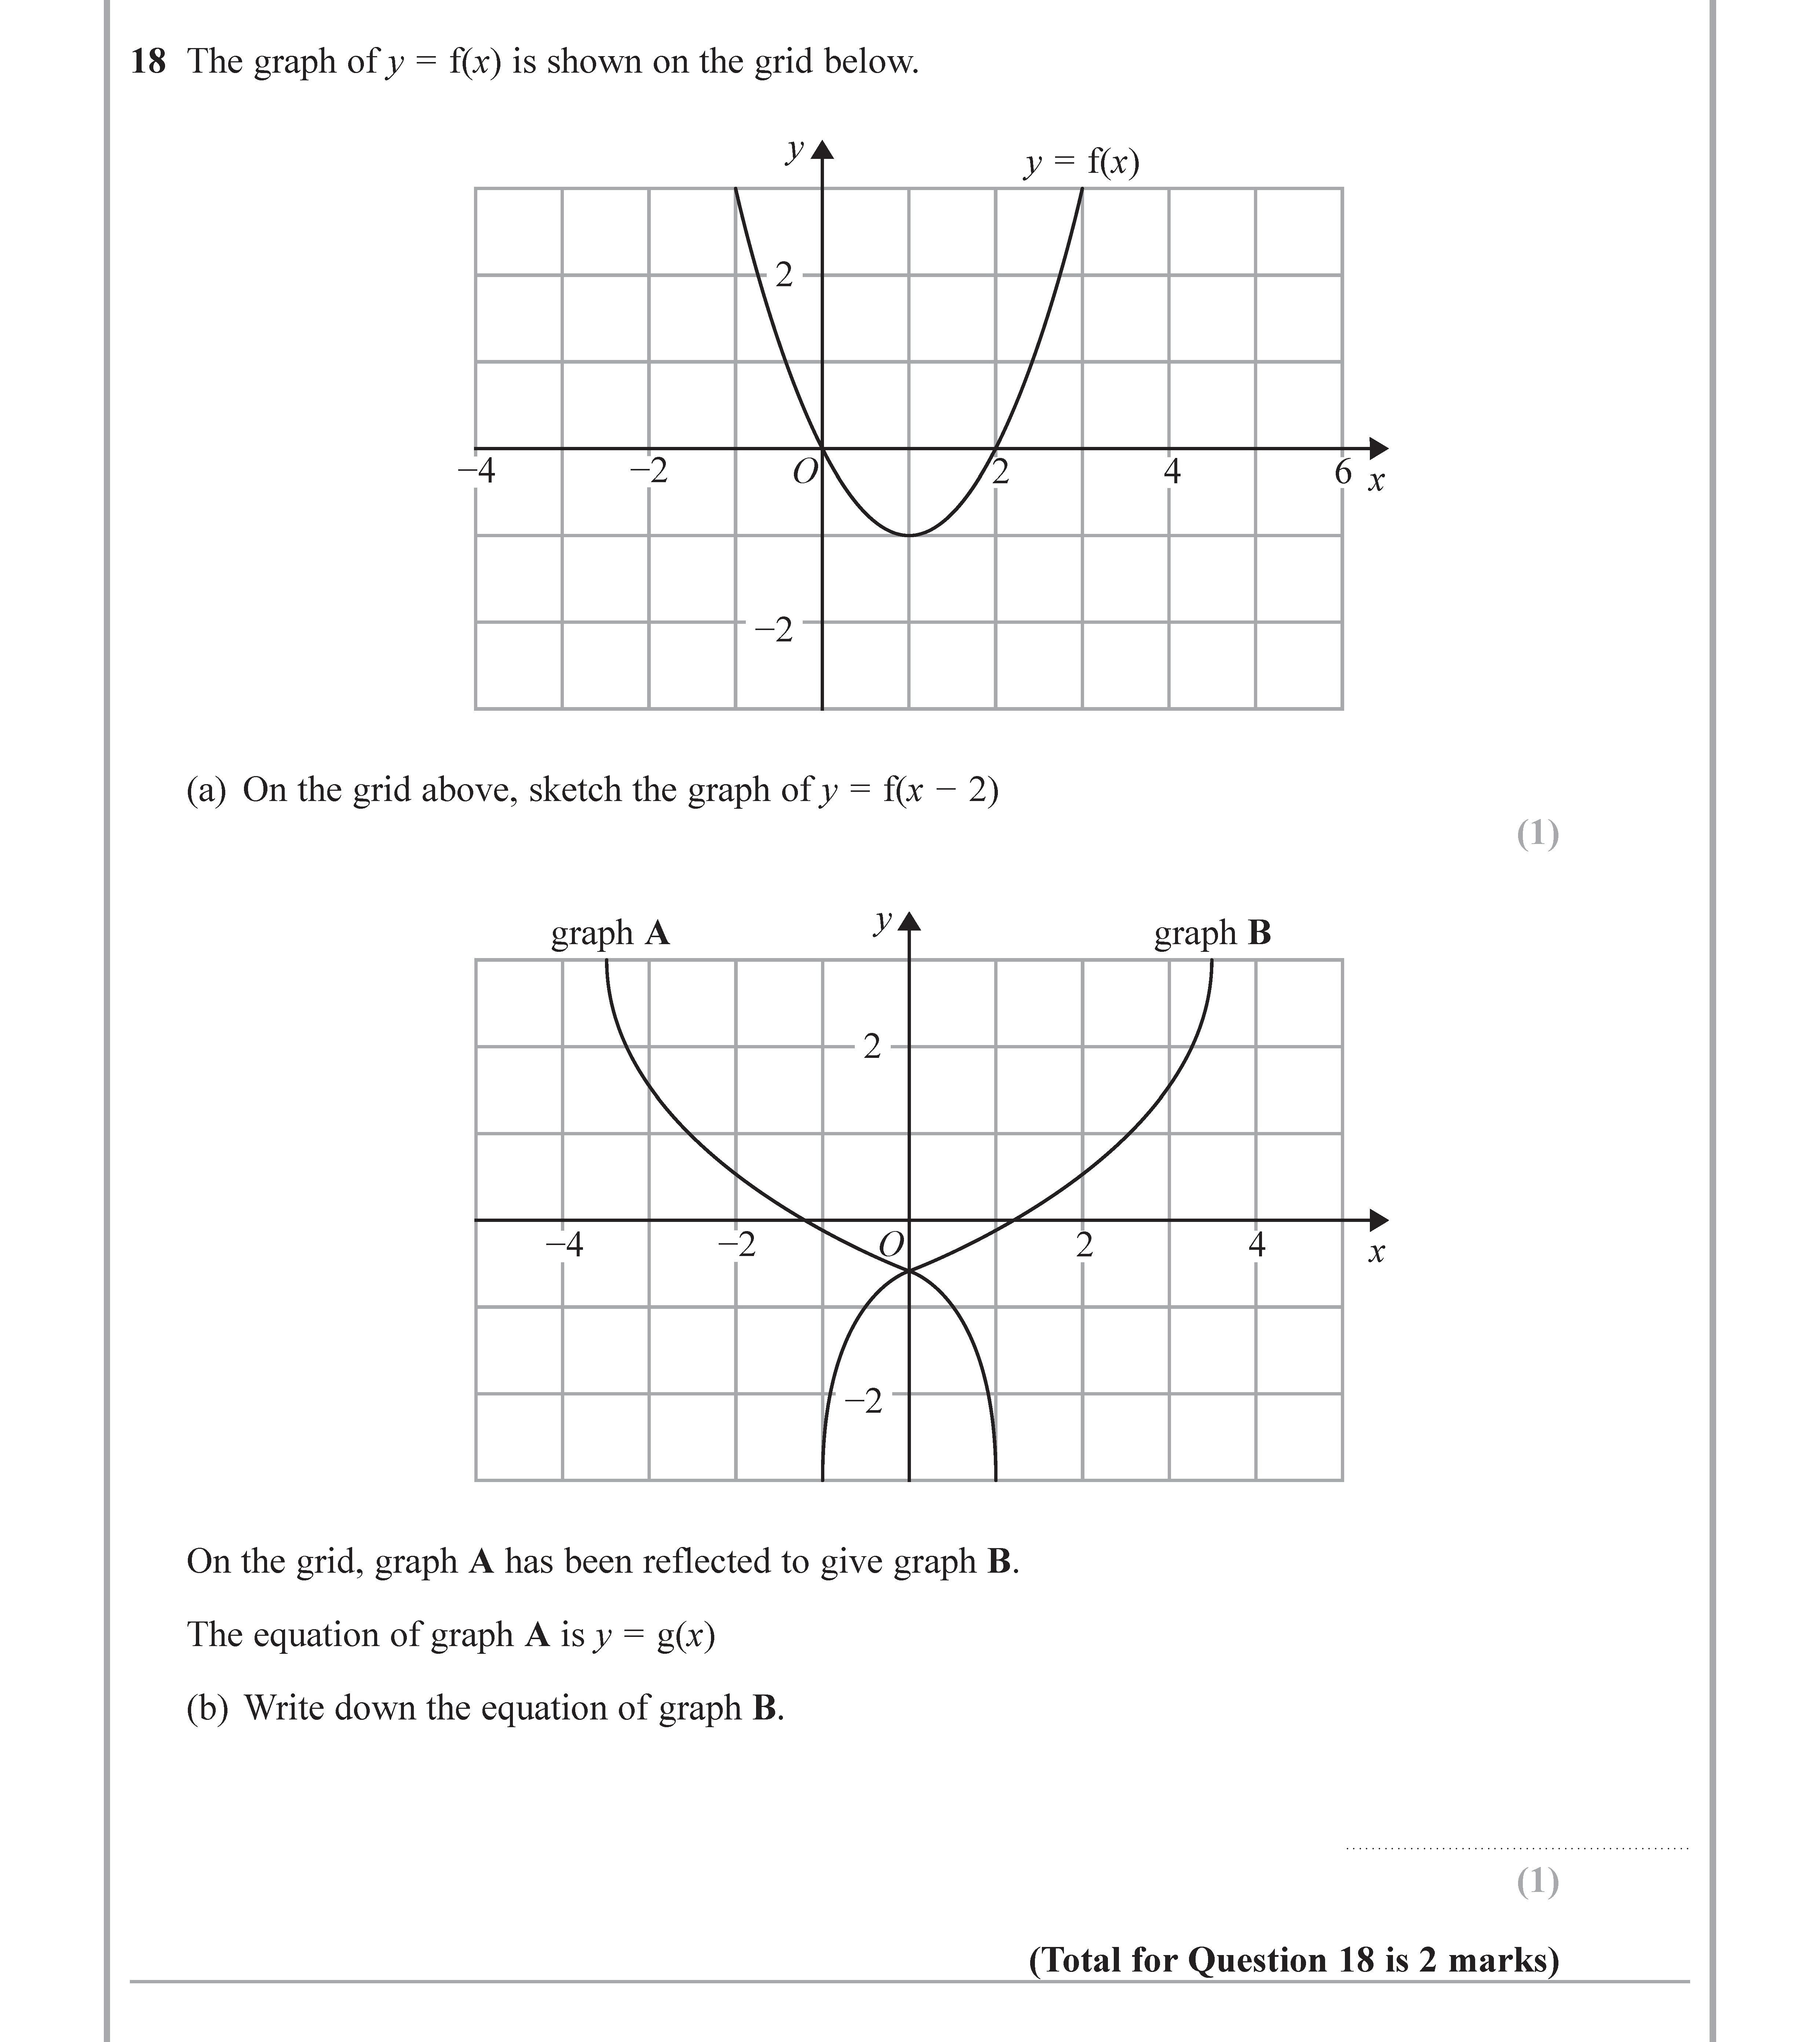
The graph of $y = f(x)$ is shown on the grid below.
(a) On the grid above, sketch the graph of $y = f(x - 2)$.
On the grid, graph A has been reflected to give grap... show full transcript
Worked Solution & Example Answer:The graph of $y = f(x)$ is shown on the grid below - Edexcel - GCSE Maths - Question 19 - 2018 - Paper 1
Step 1
On the grid above, sketch the graph of $y = f(x - 2)$
96%
114 rated
Only available for registered users.
Sign up now to view full answer, or log in if you already have an account!
Answer
To sketch the graph of y=f(x−2), you need to shift the original graph of y=f(x) two units to the right. This means each point on the graph will move rightward by 2 units, preserving its vertical position. For example, if the original graph had a minimum point at (1,−2), the shifted graph will have a minimum point at (3,−2).
Step 2
Write down the equation of graph B.
99%
104 rated
Only available for registered users.
Sign up now to view full answer, or log in if you already have an account!
Answer
Since graph B is the reflection of graph A across the x-axis, the equation of graph B can be expressed as:
y=−g(x)
Here, g(x) is the equation corresponding to graph A.