On the grid show, by shading, the region that satisfies all of these inequalities - Edexcel - GCSE Maths - Question 17 - 2021 - Paper 1
Question 17
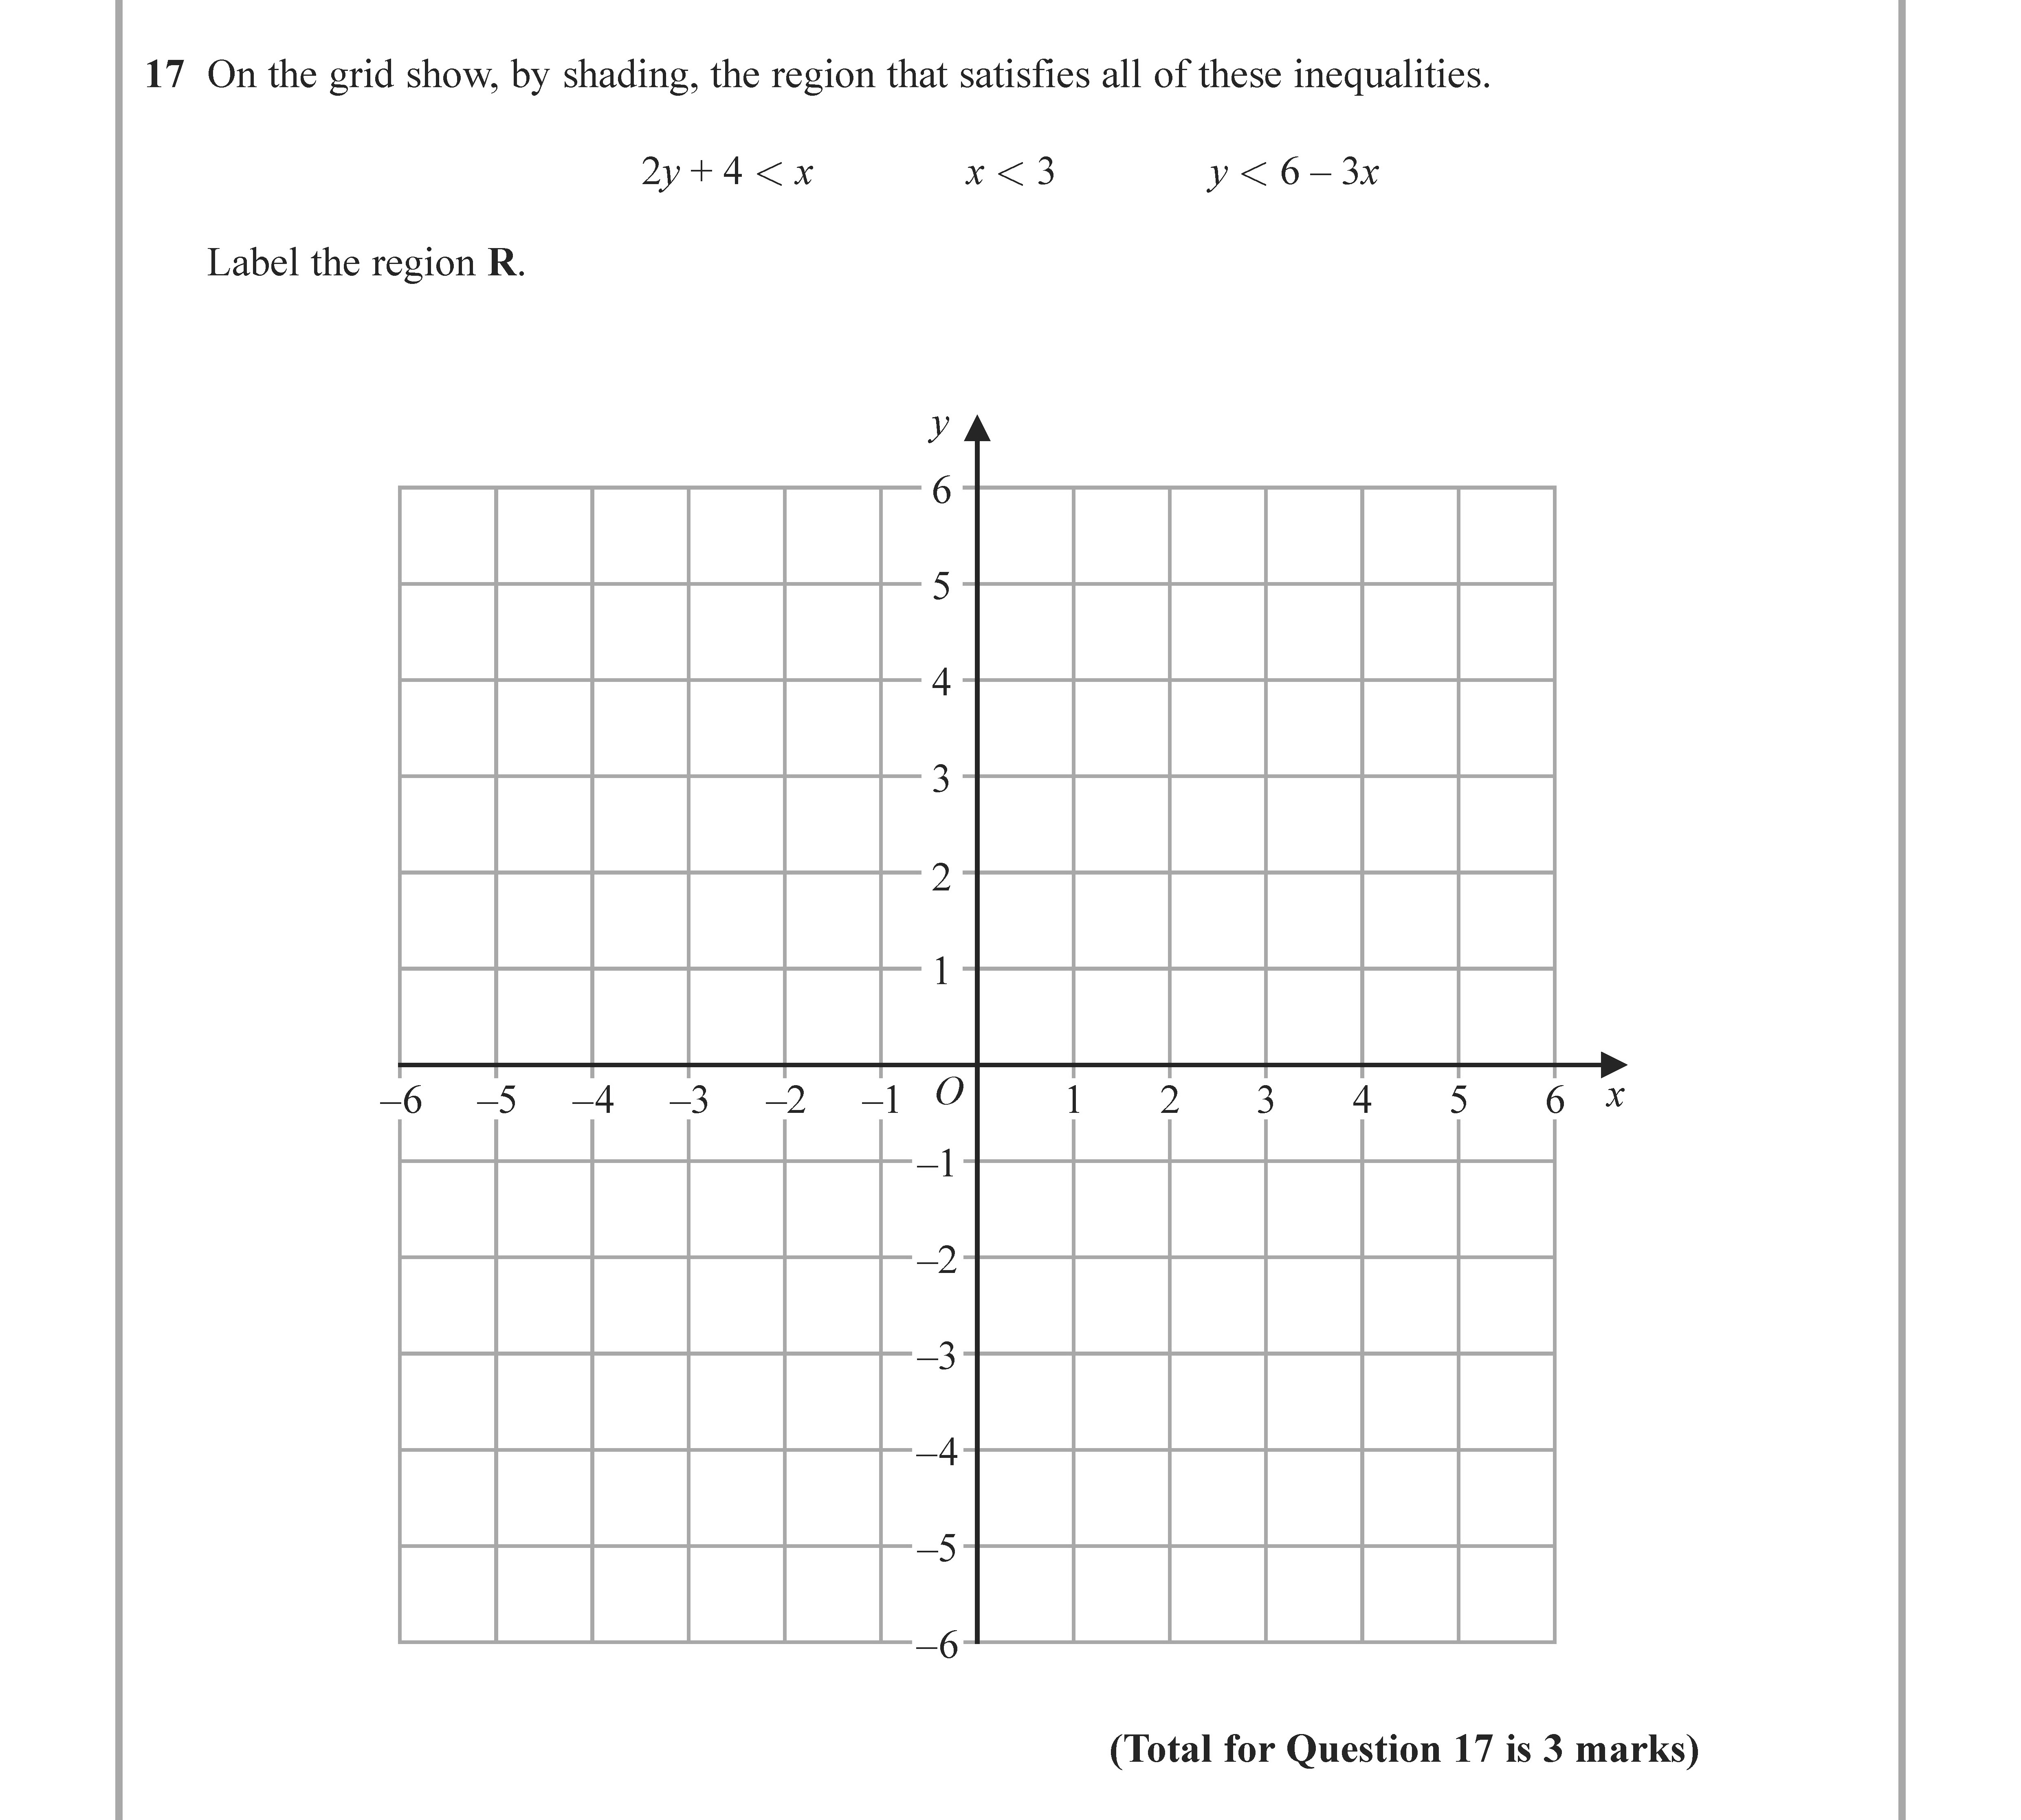
On the grid show, by shading, the region that satisfies all of these inequalities.
$2y + 4 < x < 3$
$y < 6 - 3x$
Label the region R.
Worked Solution & Example Answer:On the grid show, by shading, the region that satisfies all of these inequalities - Edexcel - GCSE Maths - Question 17 - 2021 - Paper 1
Step 1
Sketch the line for $2y + 4 < x$
96%
114 rated
Only available for registered users.
Sign up now to view full answer, or log in if you already have an account!
Answer
To find the line represented by the equation 2y+4=x, we can rearrange it to express y in terms of x:
2y=x−4y=21x−2
This is a straight line with a slope of rac{1}{2} and a y-intercept at −2. We will draw this line on the graph making sure it is dashed to represent that points on the line are not included (due to the '<' symbol).
Step 2
Sketch the line for $x < 3$
99%
104 rated
Only available for registered users.
Sign up now to view full answer, or log in if you already have an account!
Answer
The vertical line at x=3 will also be dashed. This line divides the graph into two regions; we are interested in the region to the left of this line (not including the line itself).
Step 3
Sketch the line for $y < 6 - 3x$
96%
101 rated
Only available for registered users.
Sign up now to view full answer, or log in if you already have an account!
Answer
Rearranging the inequality y<6−3x, we can draw the boundary line given by y=6−3x. This line has a y-intercept of 6 and a slope of −3. Again, a dashed line will be drawn because the inequality is strict ('<').
Step 4
Shade the correct region R
98%
120 rated
Only available for registered users.
Sign up now to view full answer, or log in if you already have an account!
Answer
The region R is the area where all three inequalities overlap. This means we will shade the area that is to the left of the line x=3, above the line y=21x−2, and below the line y=6−3x. Make sure to clearly indicate this shaded region on the graph and label it R.