Photo AI
The distance-time graph shows information about part of a car journey - Edexcel - GCSE Maths - Question 15 - 2018 - Paper 2
Question 15
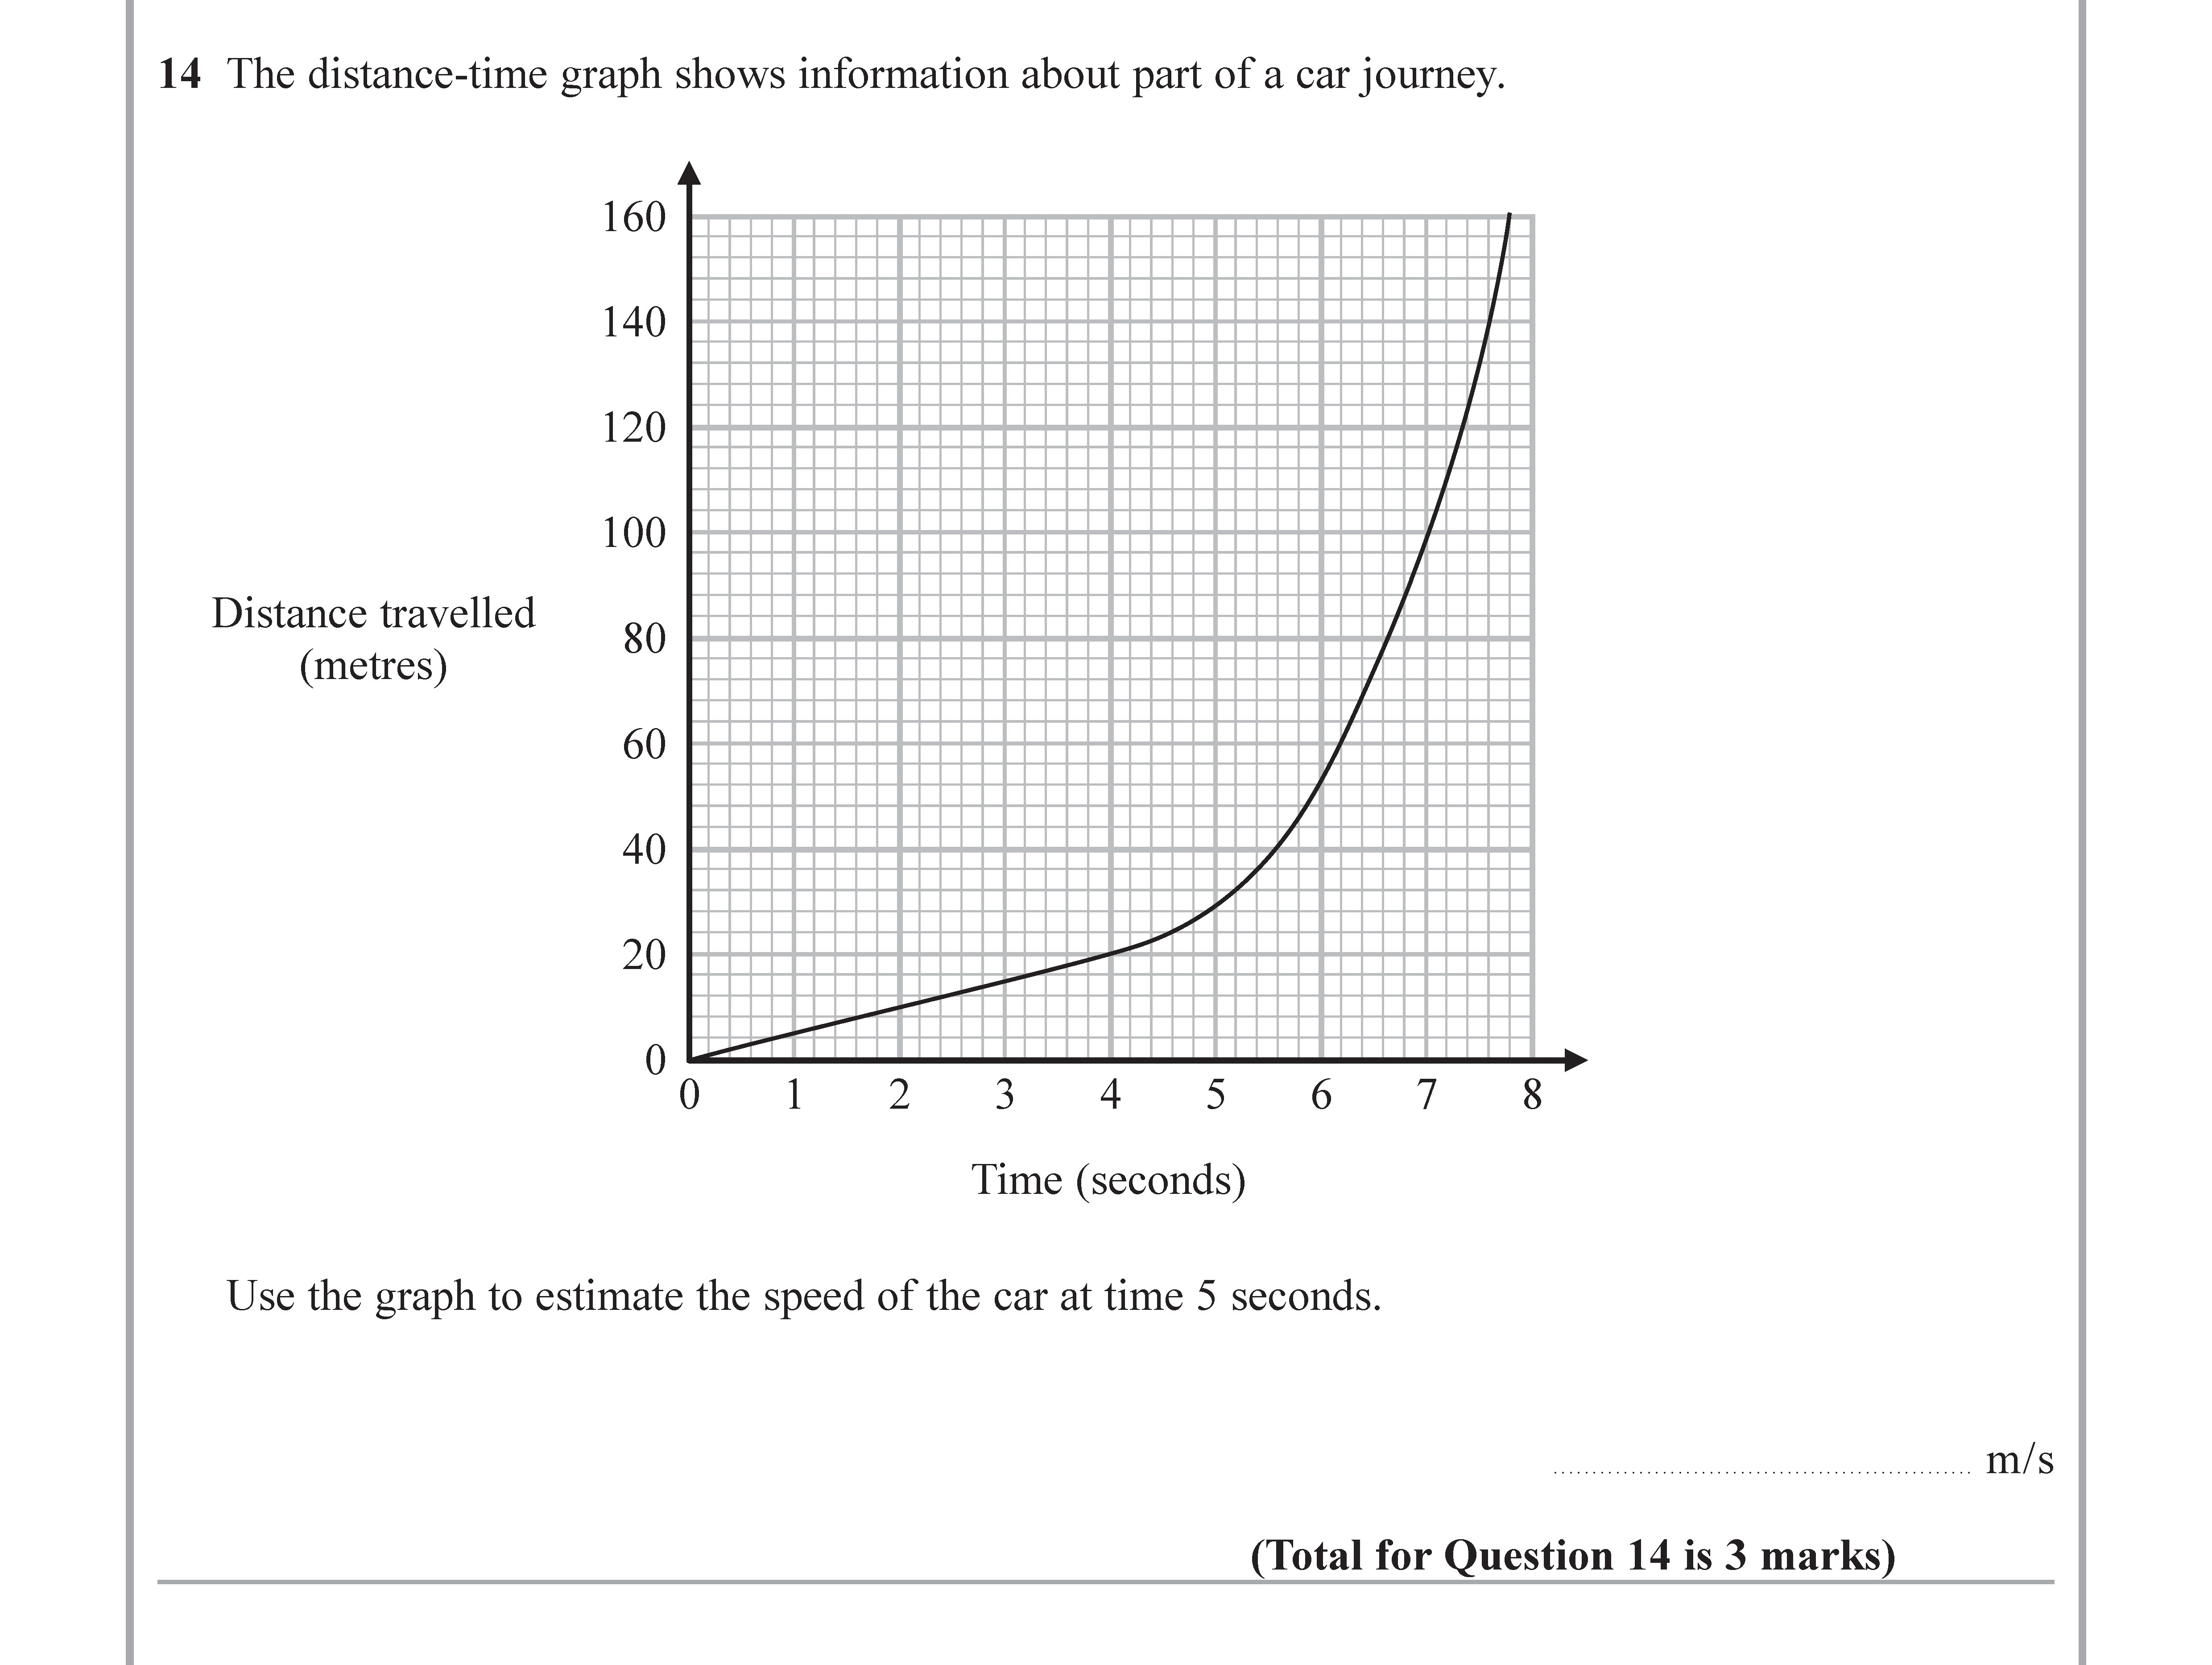
The distance-time graph shows information about part of a car journey. Distance travelled (metres) Use the graph to estimate the speed of the car at time 5 seconds... show full transcript
Worked Solution & Example Answer:The distance-time graph shows information about part of a car journey - Edexcel - GCSE Maths - Question 15 - 2018 - Paper 2
Step 1
Draw a tangent to the curve at time = 5 seconds

Answer
To estimate the speed of the car at 5 seconds, start by drawing a tangent line to the curve at the point where the time is 5 seconds. This tangent should touch the curve without crossing it, approximating the slope of the curve at that point.
Step 2
Find the gradient of the tangent
Answer
To find the gradient, choose two points on the tangent line. For instance, you may select a point at approximately (4 seconds, 90 meters) and another point at (6 seconds, 150 meters). Calculate the change in distance and change in time between these points:
Change in distance = 150 m - 90 m = 60 m
Change in time = 6 s - 4 s = 2 s
Using the formula for speed (gradient):
ext{Speed} = rac{ ext{Change in distance}}{ ext{Change in time}} = rac{60 ext{ m}}{2 ext{ s}} = 30 ext{ m/s}
Step 3